
Designed a mobile application empowering fishing charters to oversee their business on the go.

In order to provide the primary and secondary users with a product that would have little to no competition in the marketplace, I had to identify where the potential Blue Ocean would be. To do this, I conducted a Competitive Feature Analysis of direct and indirect competitors within the current market and discovered two main opportunities:
1. Personalization: Both direct and indirect competitors lack the functionality to provide users with a customized and personalized experience
2. Informative: There is a lack of information that keeps both primary and secondary users guessing and unsure of their wants/needs.
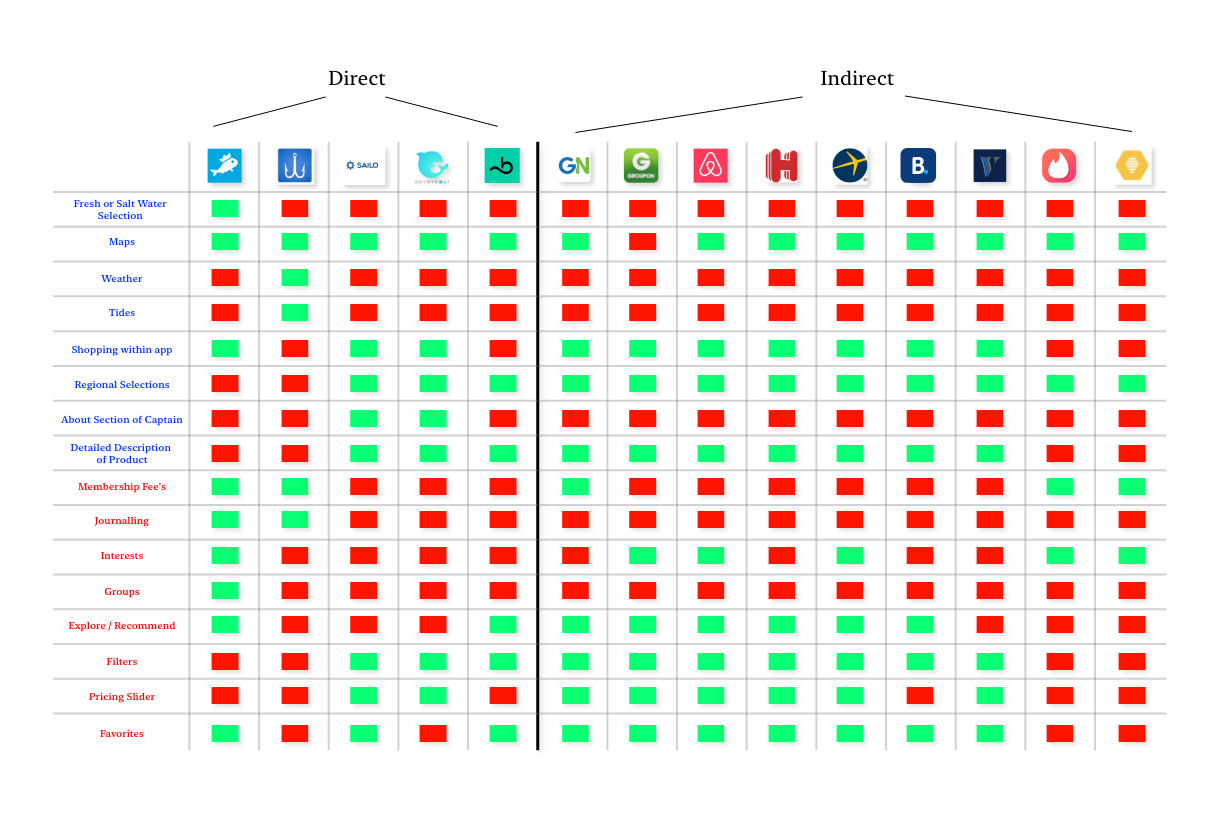
Using the themes uncovered from the feature analysis, I applied personalization and informative to the X & Y-axis respectively.
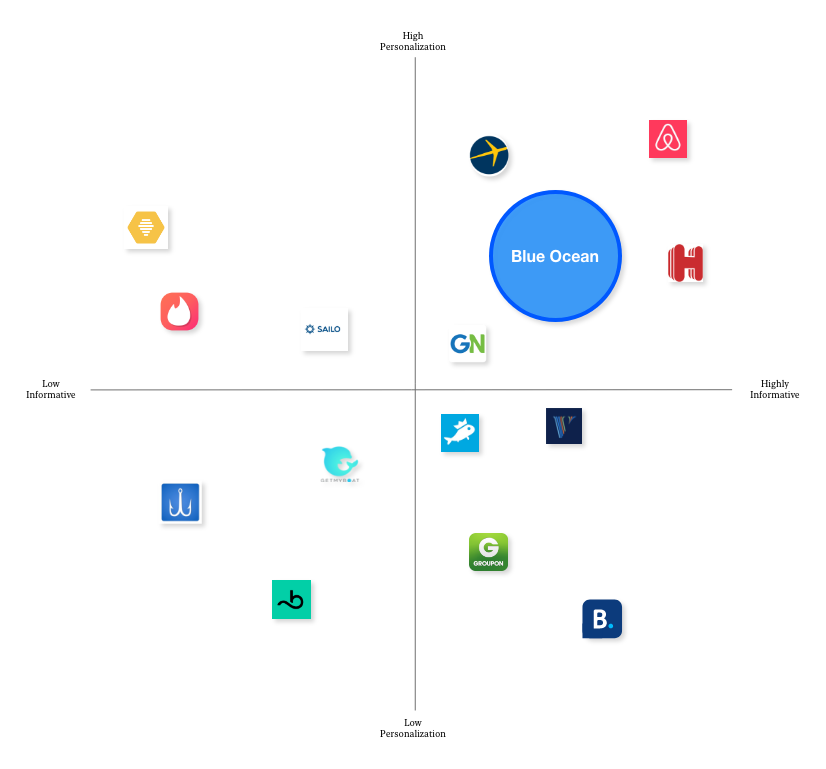
Applying the variable of low to high as the measurement indicator, I placed each of the direct and indirect competitors within the Market Positioning Chart. Once all the competitors were labeled, along with what I also assume to be a bit of sorcery, did I locate the Blue Ocean. This discovery indicated that there was an opportunity for our client to develop and launch a product that would provides users with the tools to improve customization/personalization all while providing users with a highly informative platform it came to booking fishing charters and boat captains.
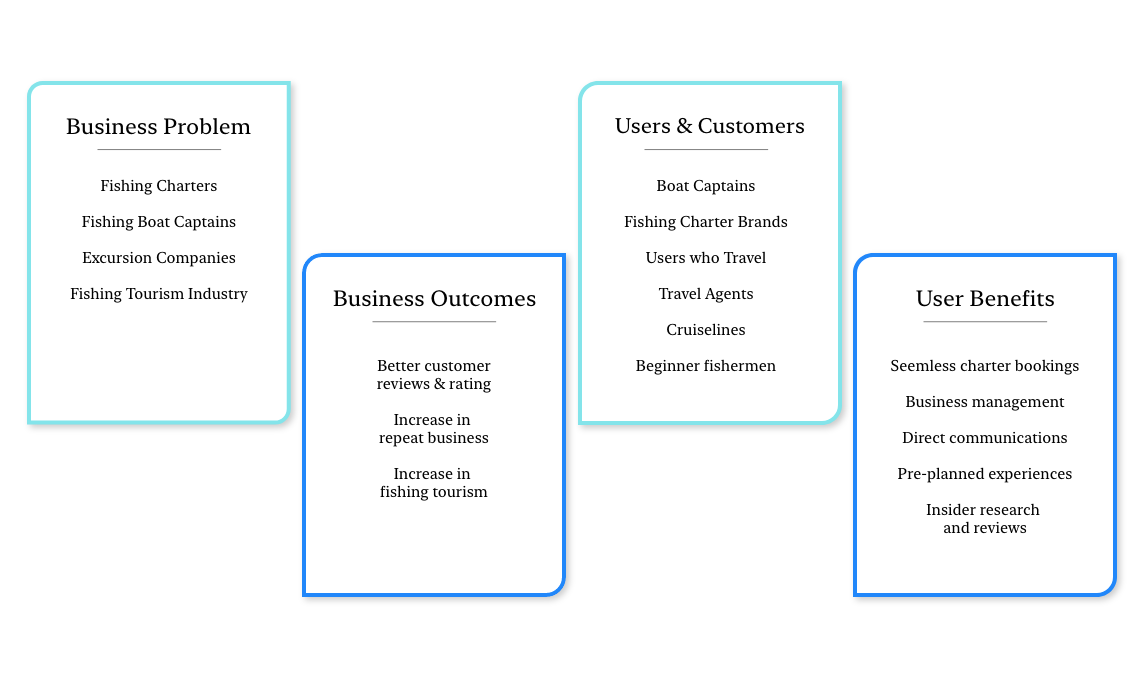
With the Blue Ocean located, I needed to further define what the Business Problems and Outcomes along with defining who the Primary and Secondary Users were. Using the ever so handy Lean UX Canvas, I was able to do just that and defined the Business Problem and Outcomes and Primary and Secondary Users:
Having a solid foundation of pain points from our client, I moved into developing interview and survey questions. Before sending out the survey or conducting additional interviews, I spoke with one interviewee initially to ensure that the questions asked would provide quantifiable data. With a quick pivot and change to my questions, I sent out the survey and moved into conducting additional interviews.
Using google forms I developed a total of eleven survey questions that would help define demographic along with user travel and booking methods/history.
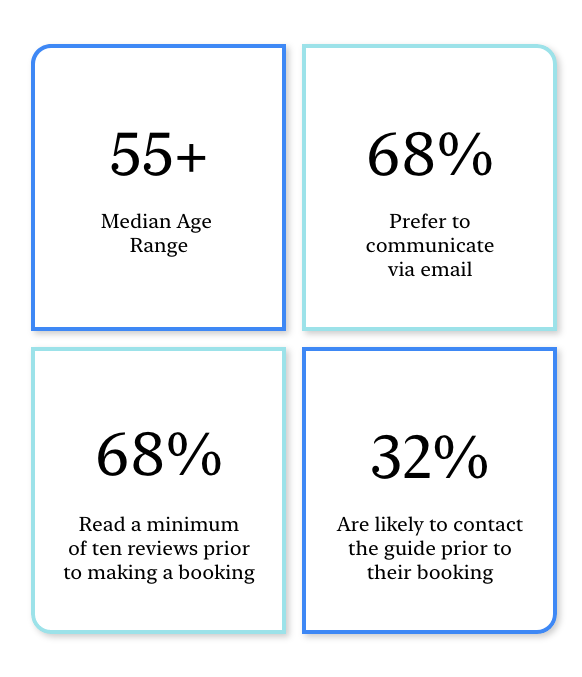
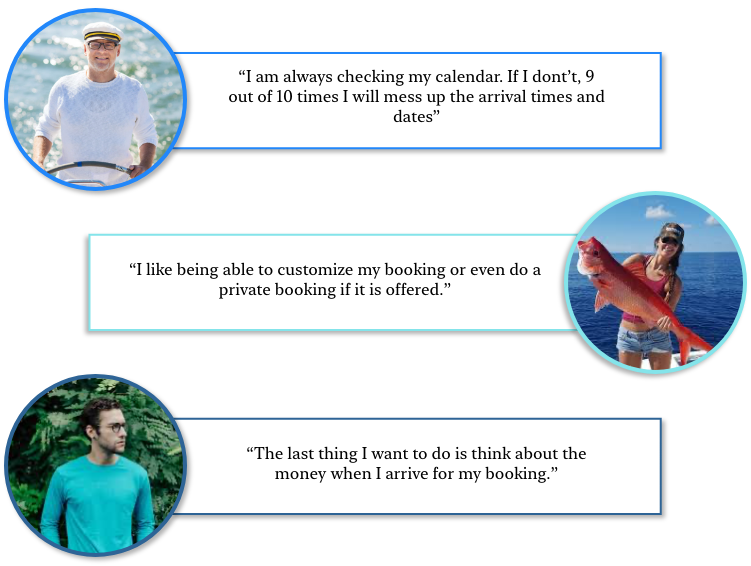
With my survey all grown up and on it’s own, I now had to focus on reconnecting with mankind through the interview technique. During my encounters, I took a notebook’s worth of information and data that interviewees were willing to share with me. I also made sure to take down a couple key quotes that would help me further in the process.
Having all this data can seem quite overwhelming, but luckily I have an arsenal of techniques and tools that will help me organize and make sense of all the data collected from the user research.

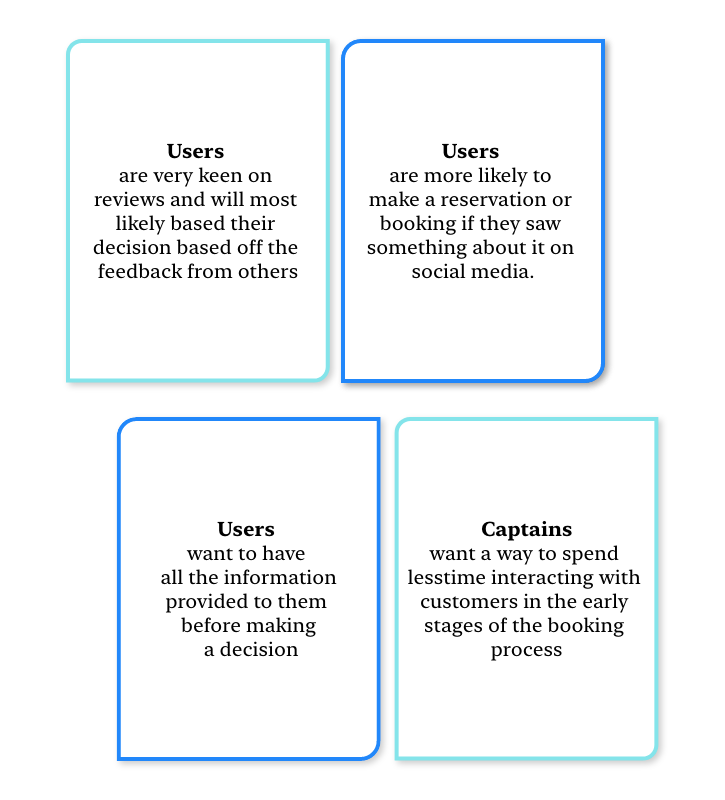
When used in the correct manner the Affinity Map will assist in organizing user research data into groups or themes. From the Affinity Map, I was able to summarize my findings into the following:
With key findings from the Affinity Map in my back pocket, I turned my focus to the customer side of the Value Proposition Canvas to define the job(s) that our product or service are being hired to accomplish.
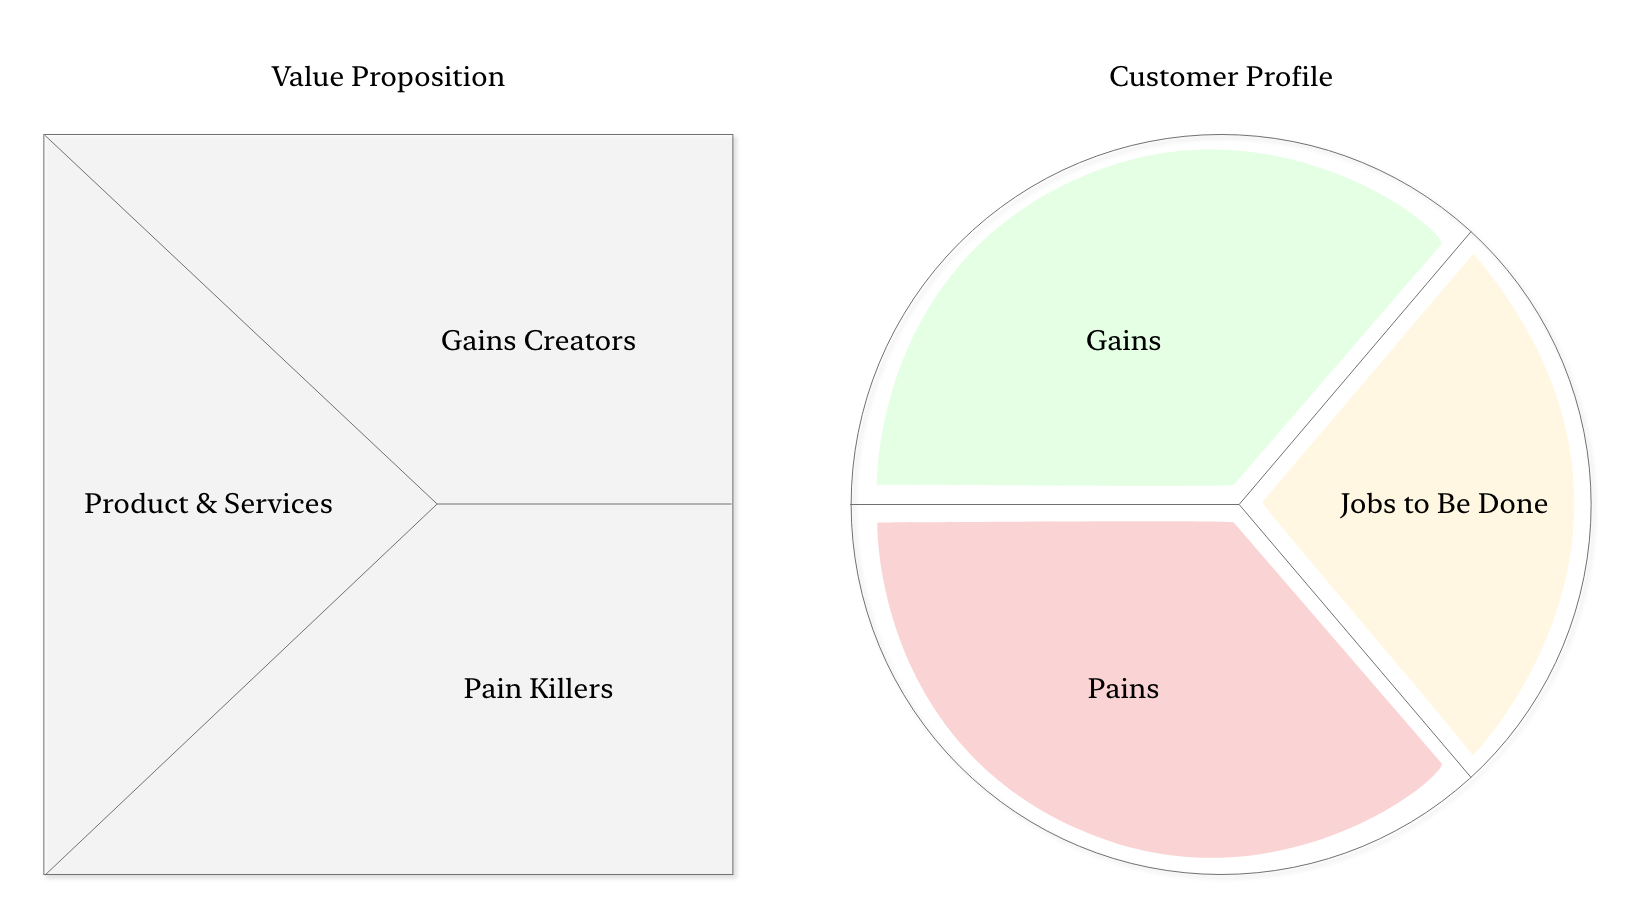
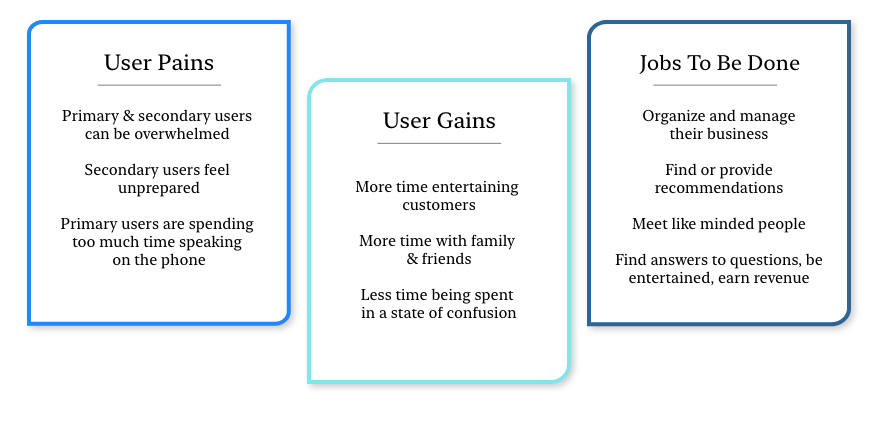
Starting with the customer side of the Value Proposition allows me to define the Pains, Gains and User Jobs also known as Jobs to Be Done.
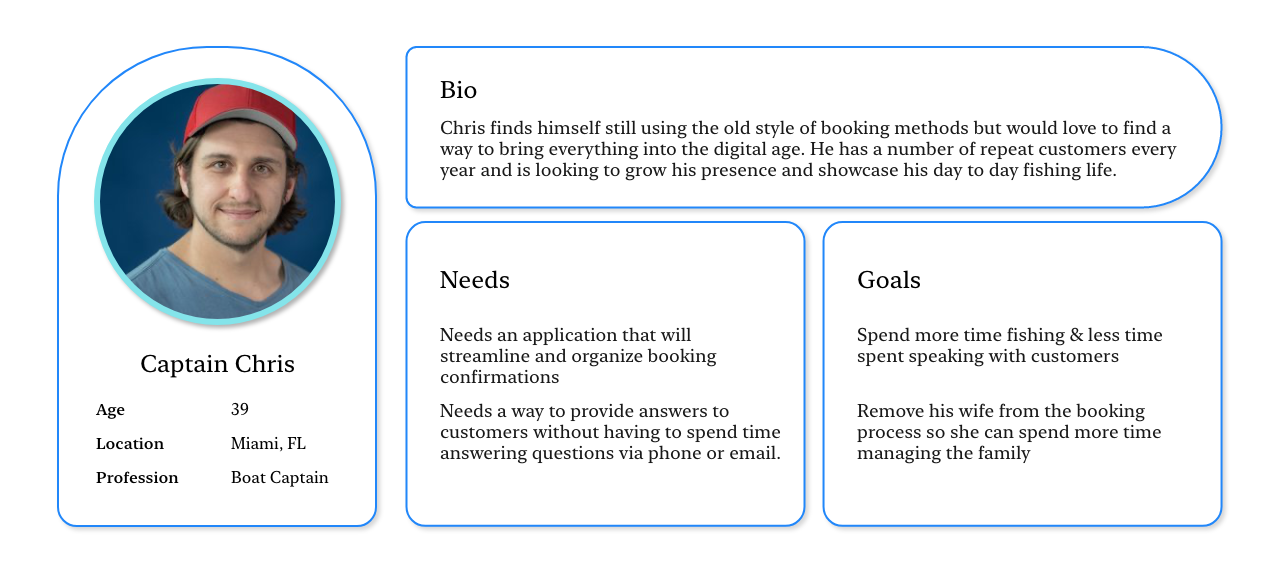
Based on these discoveries, I was able to put a face to our user type and developed the user persona Captain Chris. Development of the user persona helps reduce the risk of losing sight of our users’ mental model.
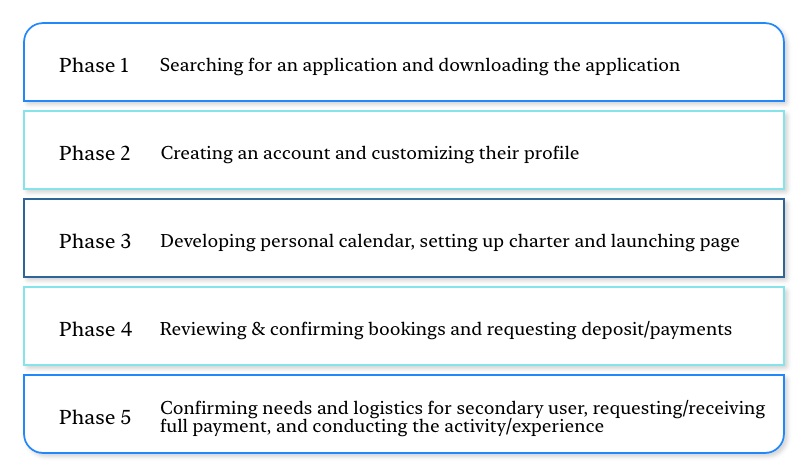
With our user persona in place, I moved into developing the user journey and correlating phases that the users would be navigating through in their current state. After a few attempts, I settled on these five phases:
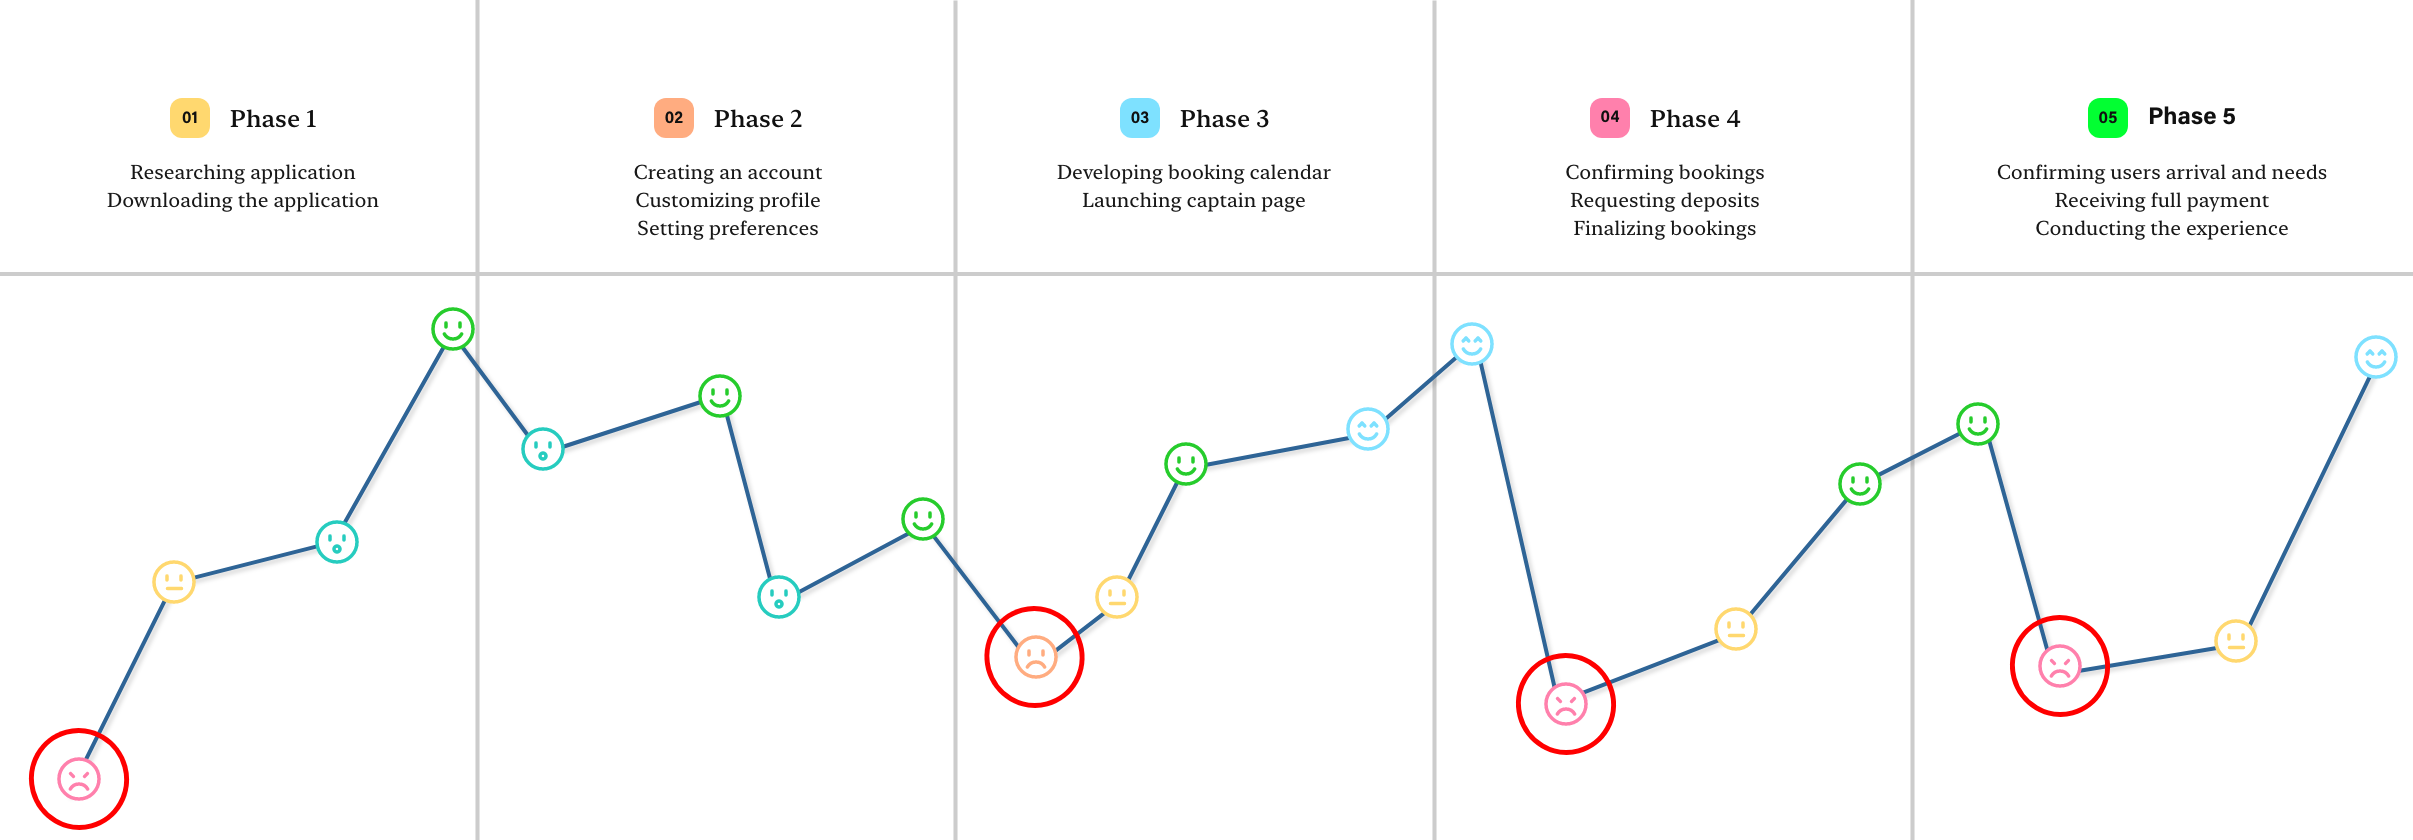
With the phases clearly defined, I moved into developing the User Journey Map. Development of the User Journey Map allows for visualization of the high and low's of the user experience and provides an opportunity to add context to each phase to identify Captain Chris's main pain points.
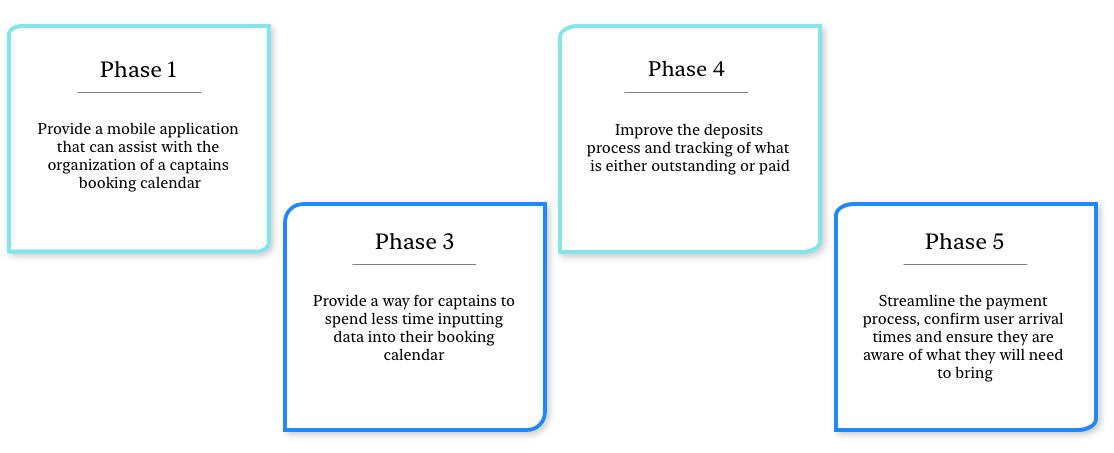
From the User Journey Map, I was able to identify a few potential design opportunities within four of the five phases:
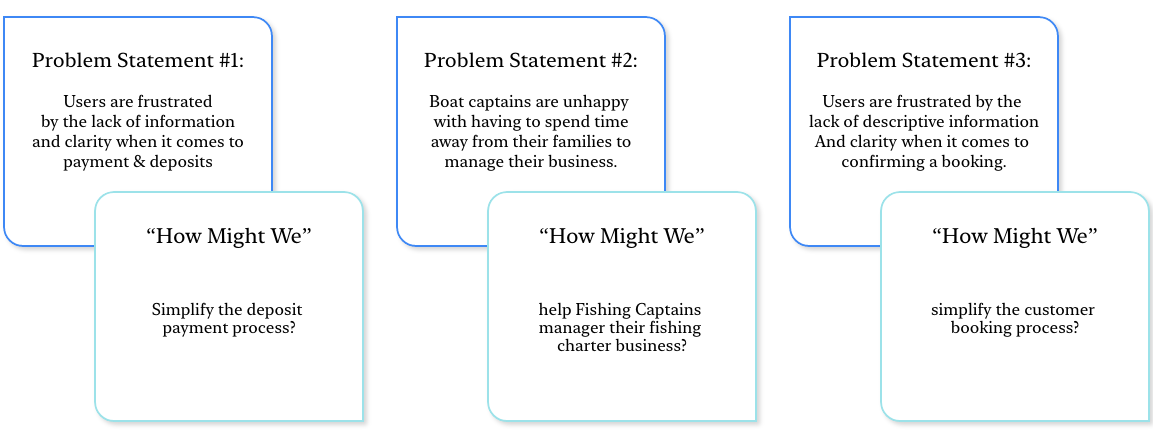
Combining the synthesized data from our research and reviewing the pain points within the journey map, I developed the following problem statements and correlating How Might We's:

At this stage, it would be beneficial to invite stakeholders to be apart of the brainstorming session. This would ensure that our ideas aligned with the business’ capabilities as well as creating a space where everyone gets a say. Unfortunately, our client opted to not take part in our brainstorming session and thus I was left to ideate with my fellow classmates.
While I wish the MoSCoW Method had something to do with the Russian City or really just vodka, it is still helpful when trying to prioritize features. Once I had my MoSCoW tool setup, it was now time to begin placing each of the brainstormed features or solutions into the categories of “Must Have, Should Have, Could Have, Won’t Have”.

Once completed I turned my focus to the Must Have’s and Should Have’s and moved on to developing the MVP.
Having a clear direction from the development and use of the MoSCoW Method, I was now in a position to develop the MVP statement.
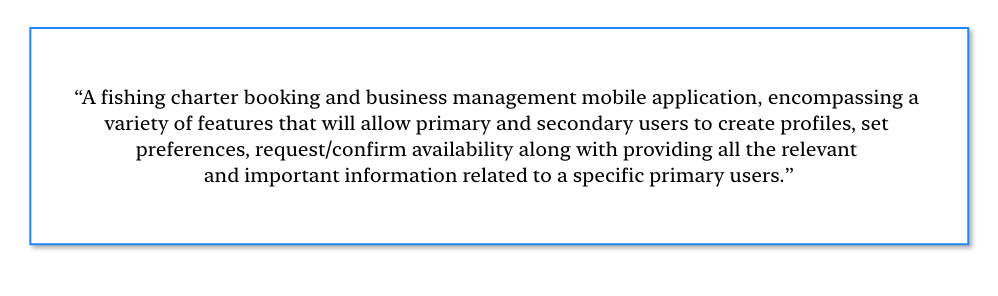
As you can see the MVP encompasses everything we have learned and brainstormed during the initial stages of the process. With the MVP clearly defined I was now ready to move towards developing my prototypes.
Before getting to the prototyping, I developed a Site Map and User Flow to help ensure that we included and stayed within the parameters of the MVP.
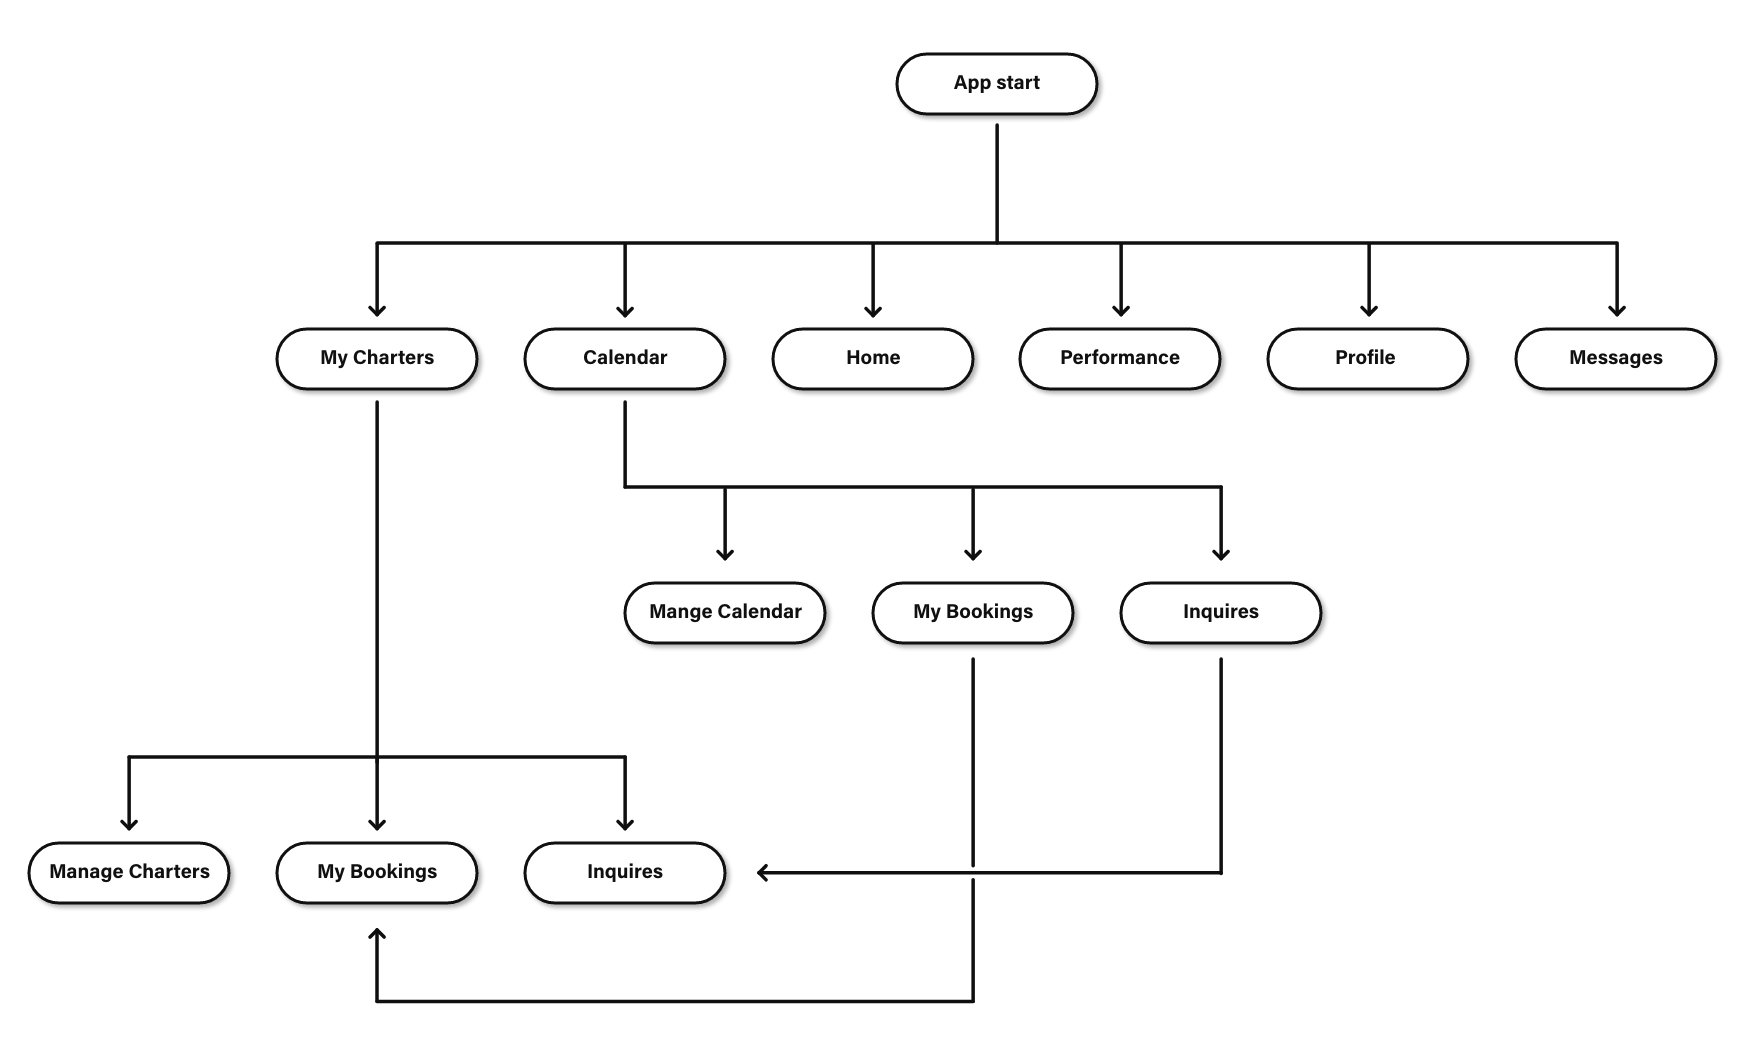
The Site Map pictured above is what you could call the skeleton of the application. It shows the initial underlying paths that user would be able to take when traveling within the app.
While the User Flow may seem very similar, it does provide an additional depth of detail in visualizing each of the possible tasks.
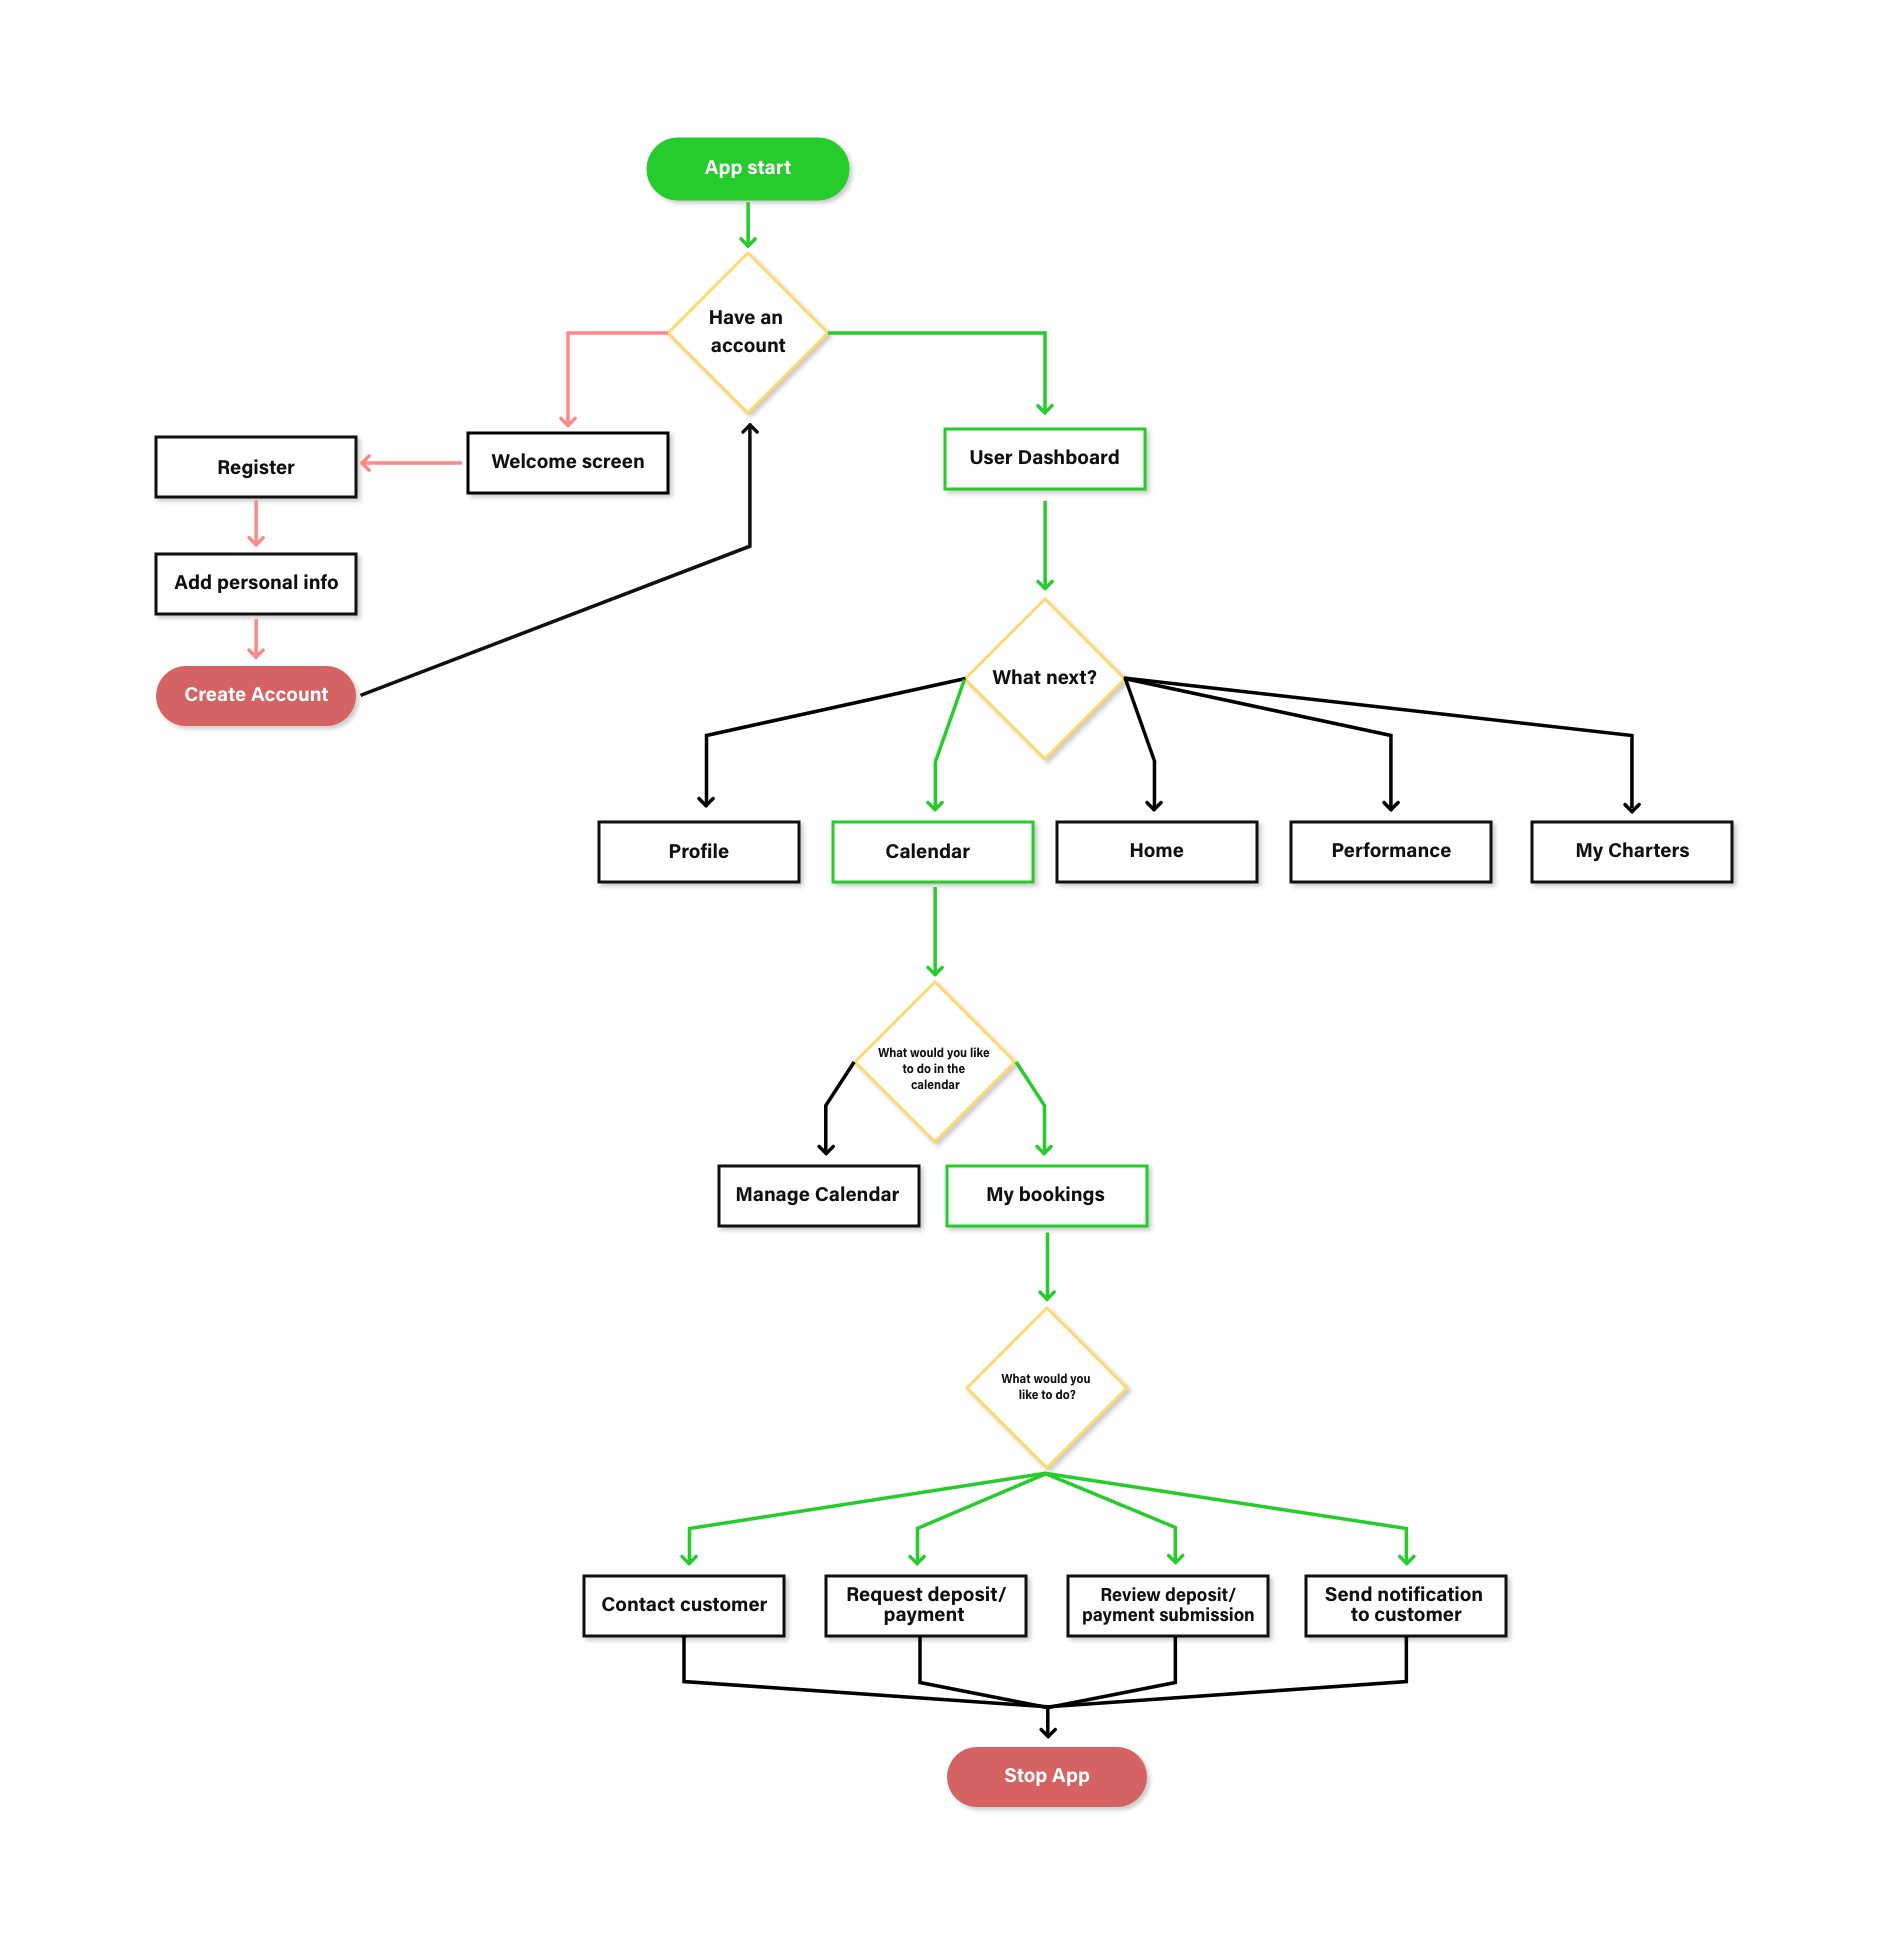
Another benefit of the User Flow is the opportunity to visualize the “Happy Path”. The green line on the image above, dictates what I believe to be the simplest and quickest path a user would take when accomplishing the task of calendar management.

With time winding down on this 9-day sprint, I moved into the final stage of the Double Diamond process also known as the Delivery Stage. To begin this stage, I started by developing what I would call a Lo/Mid-Fi Prototype.
Once I had the prototype in a spot that I was initially happy with, I uploaded it to the usability testing website — Maze.design .
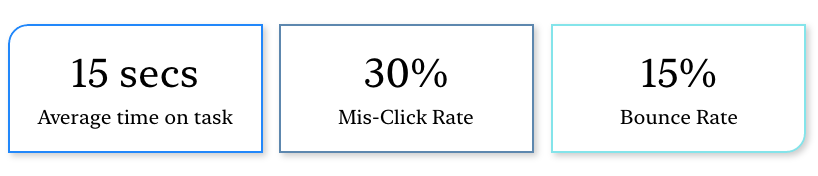
While not overly thrilled with my initial usability testing, I made some adjustments and moved into developing my Style Guide and Hi-Fi Prototype.
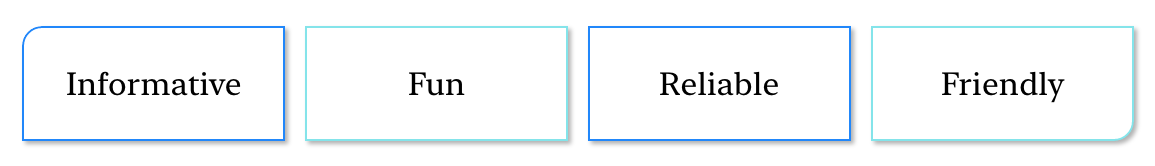
Before I just started picking random colors and fonts, I wanted to give the application a sense of feeling and emotion. In order to do this I developed the following brand attributes to help define how the brand should be portrayed.
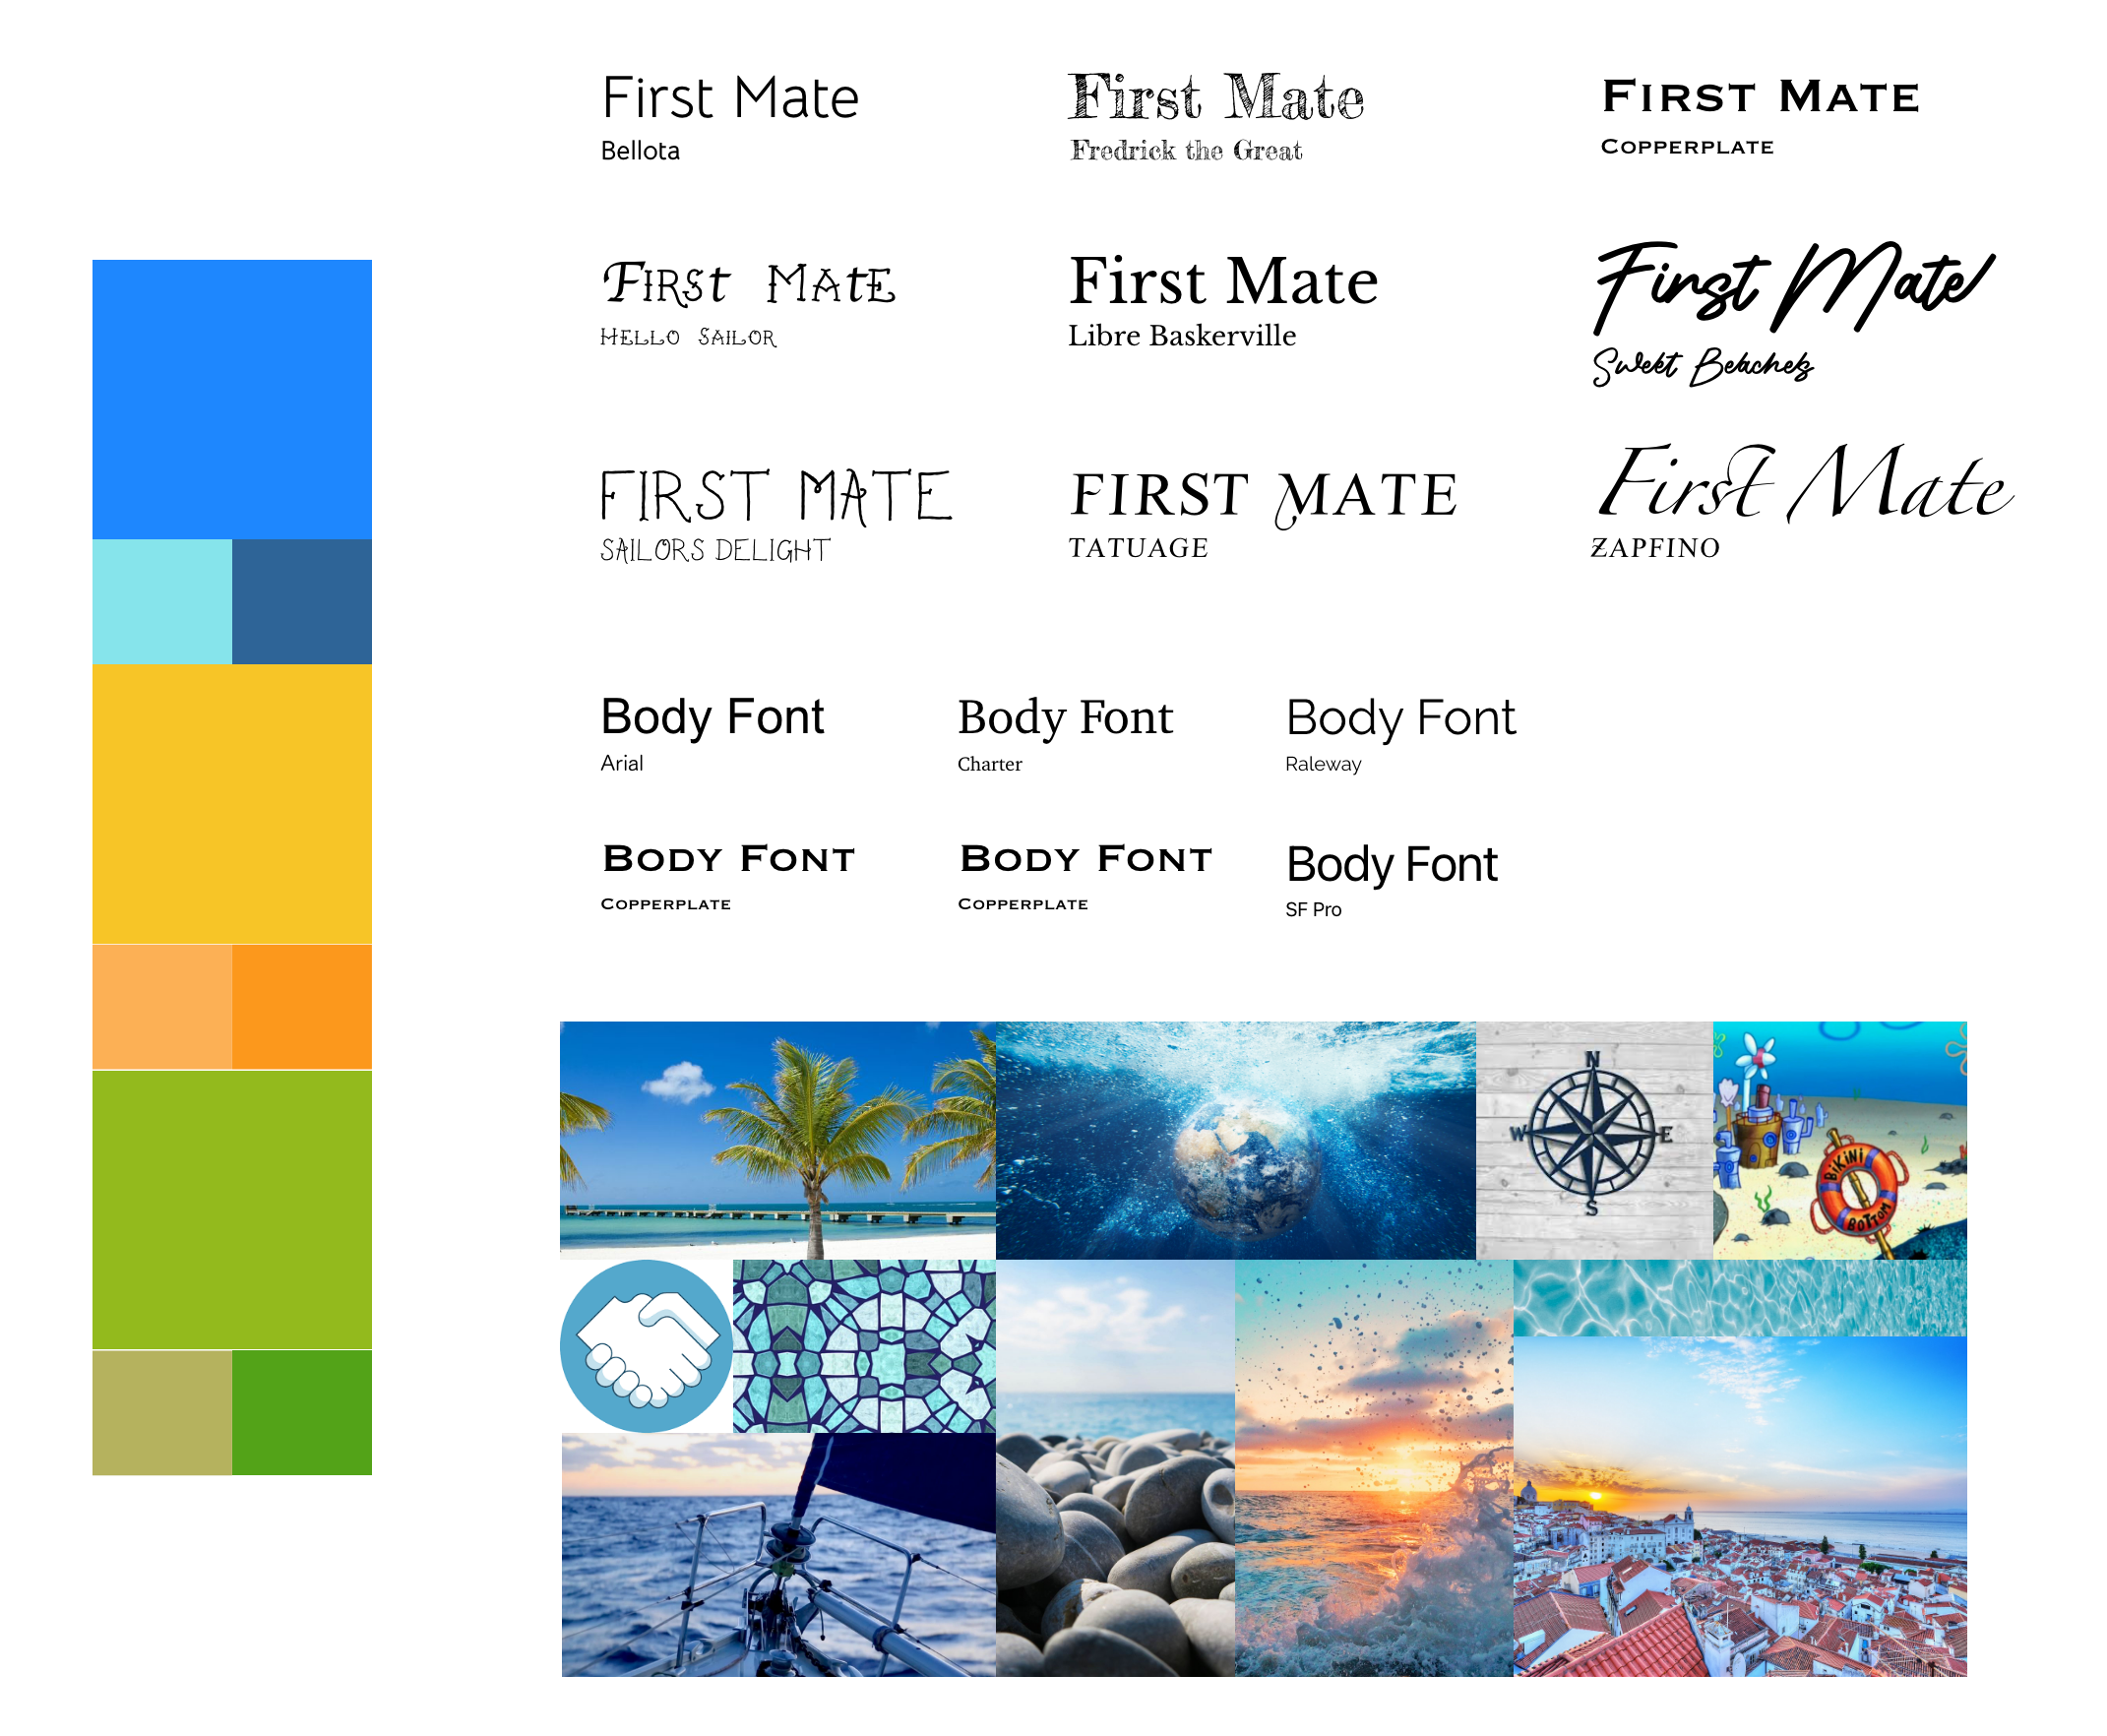
Using the brand attributes, I put together the first iteration of the Mood Board. Developing Mood Boards allows designers to test potential colors, font families and textures.
With the help of some classmates, family and friends, I conducted usability testing to get qualitative data and noted some of the key quotes down below:
After a couple changes based off feedback from my user testing, I developed the correlating Style Tile.
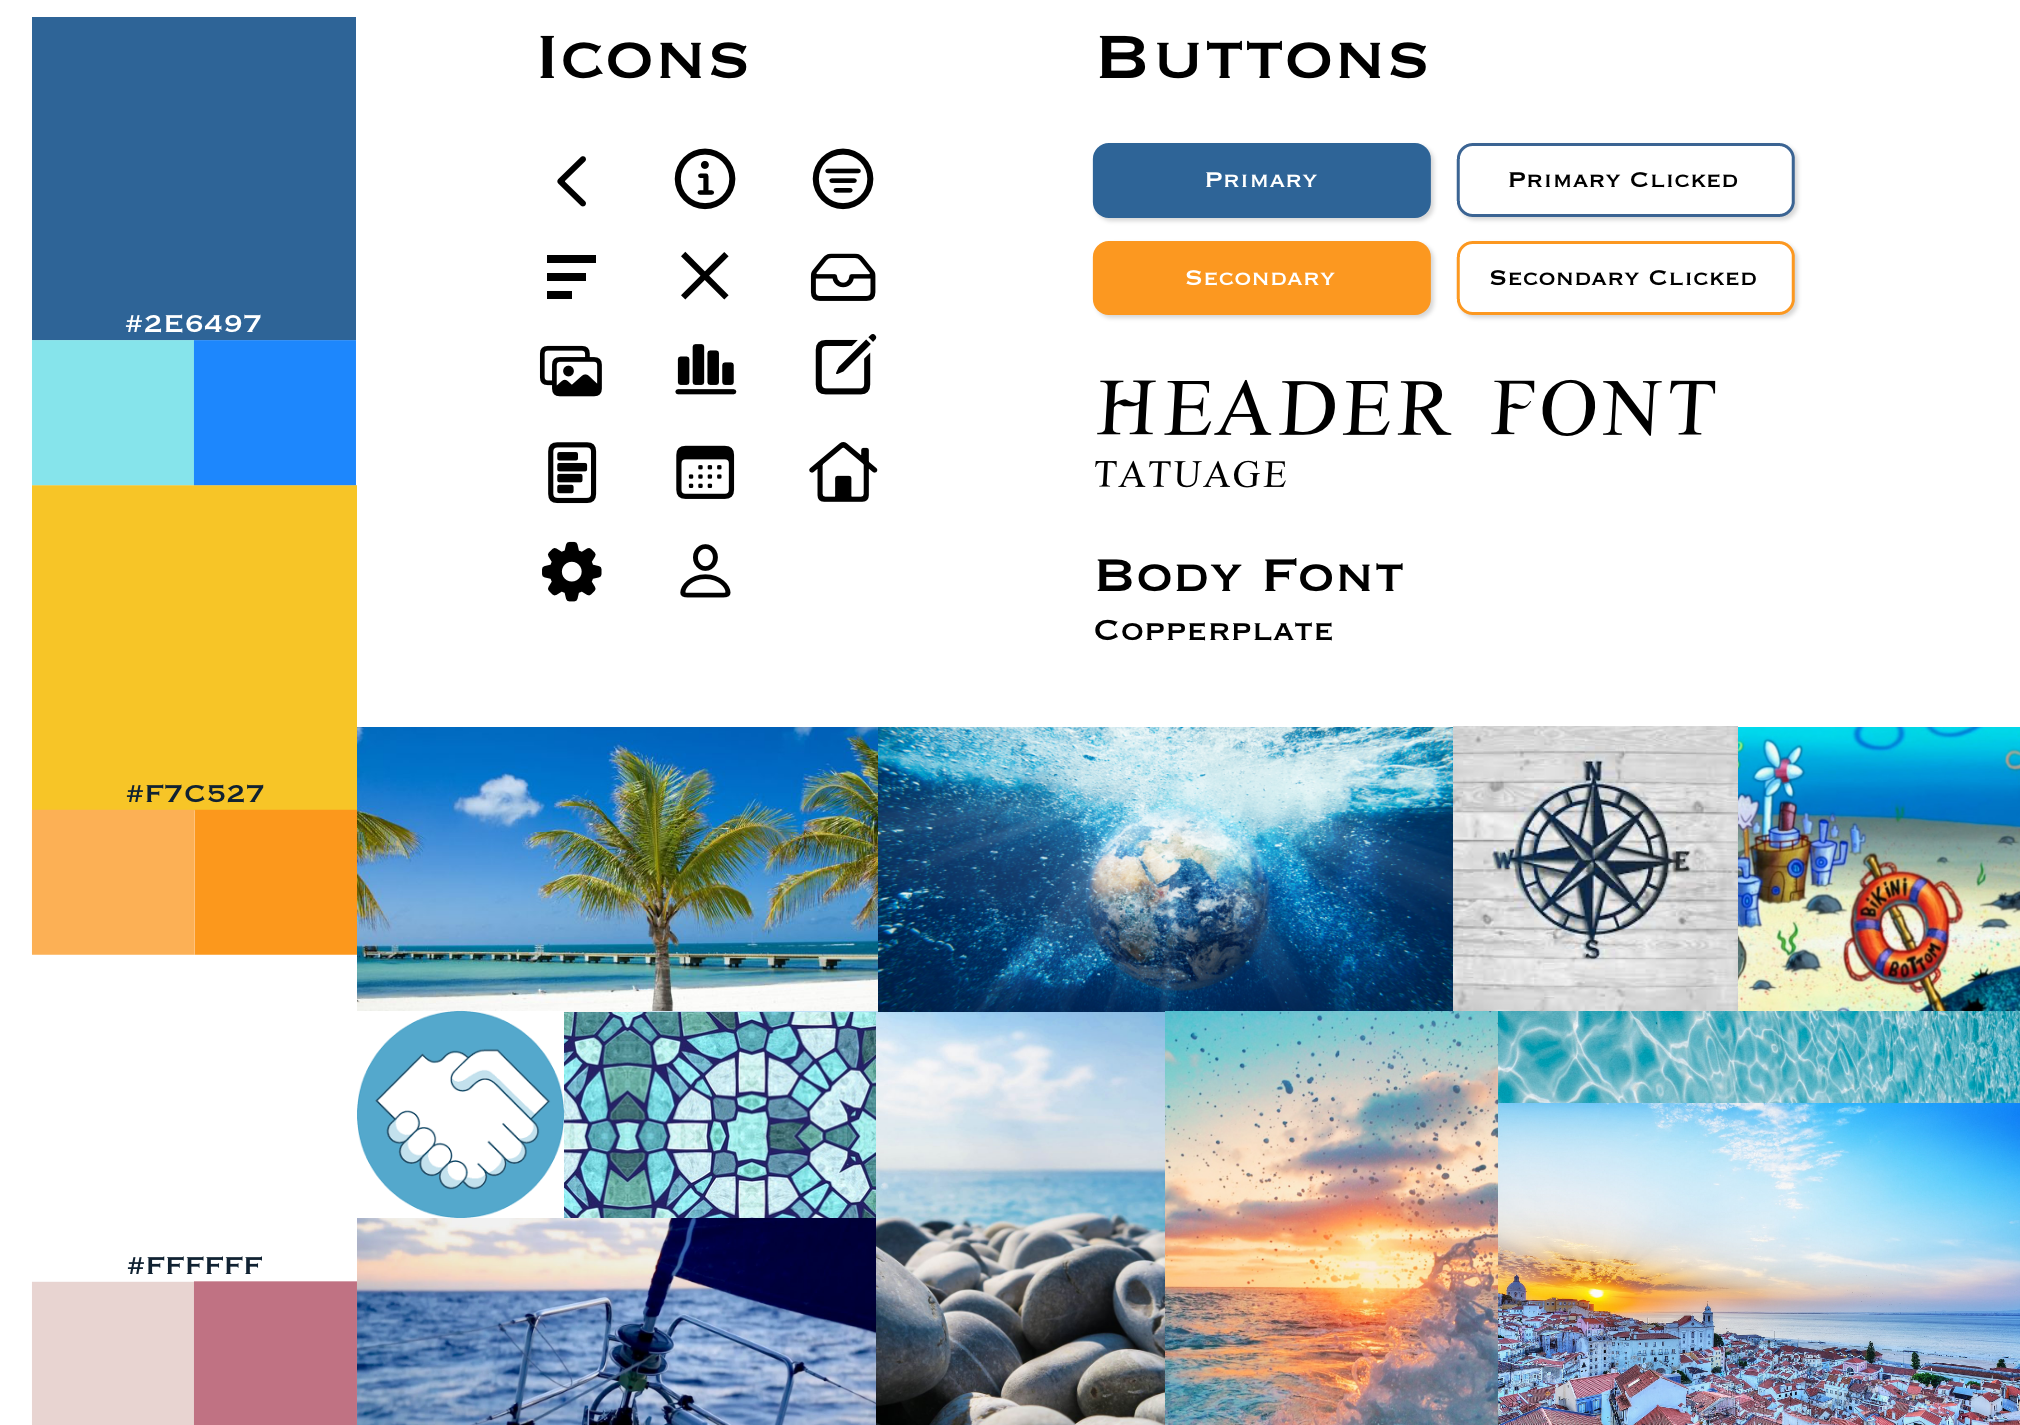
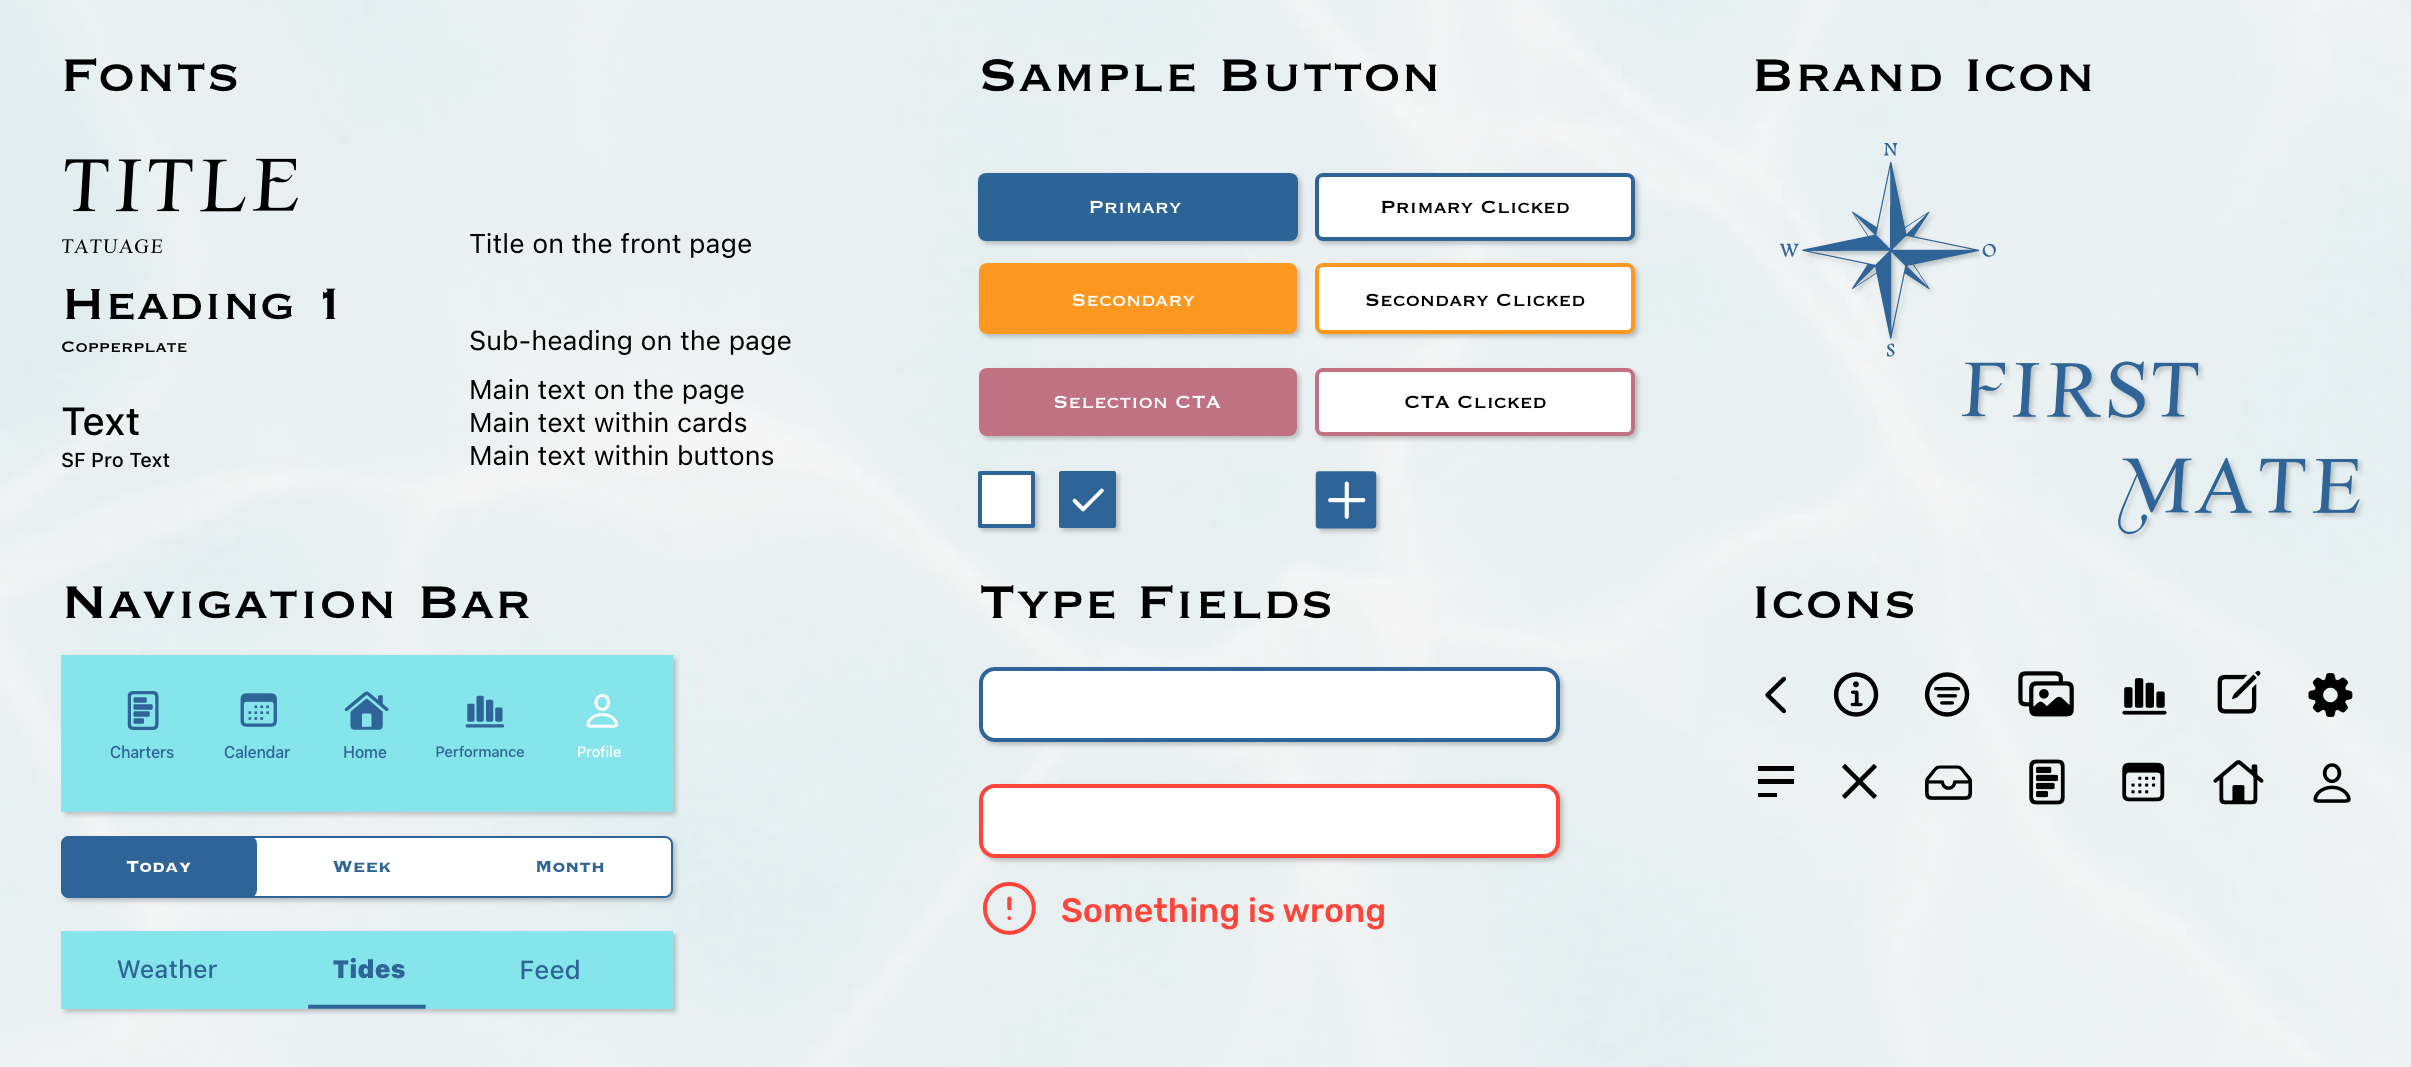
In order to stay organized, consistent and to ensure what could be a seamless handoff to the development team, I established a design system to use as a pattern library.
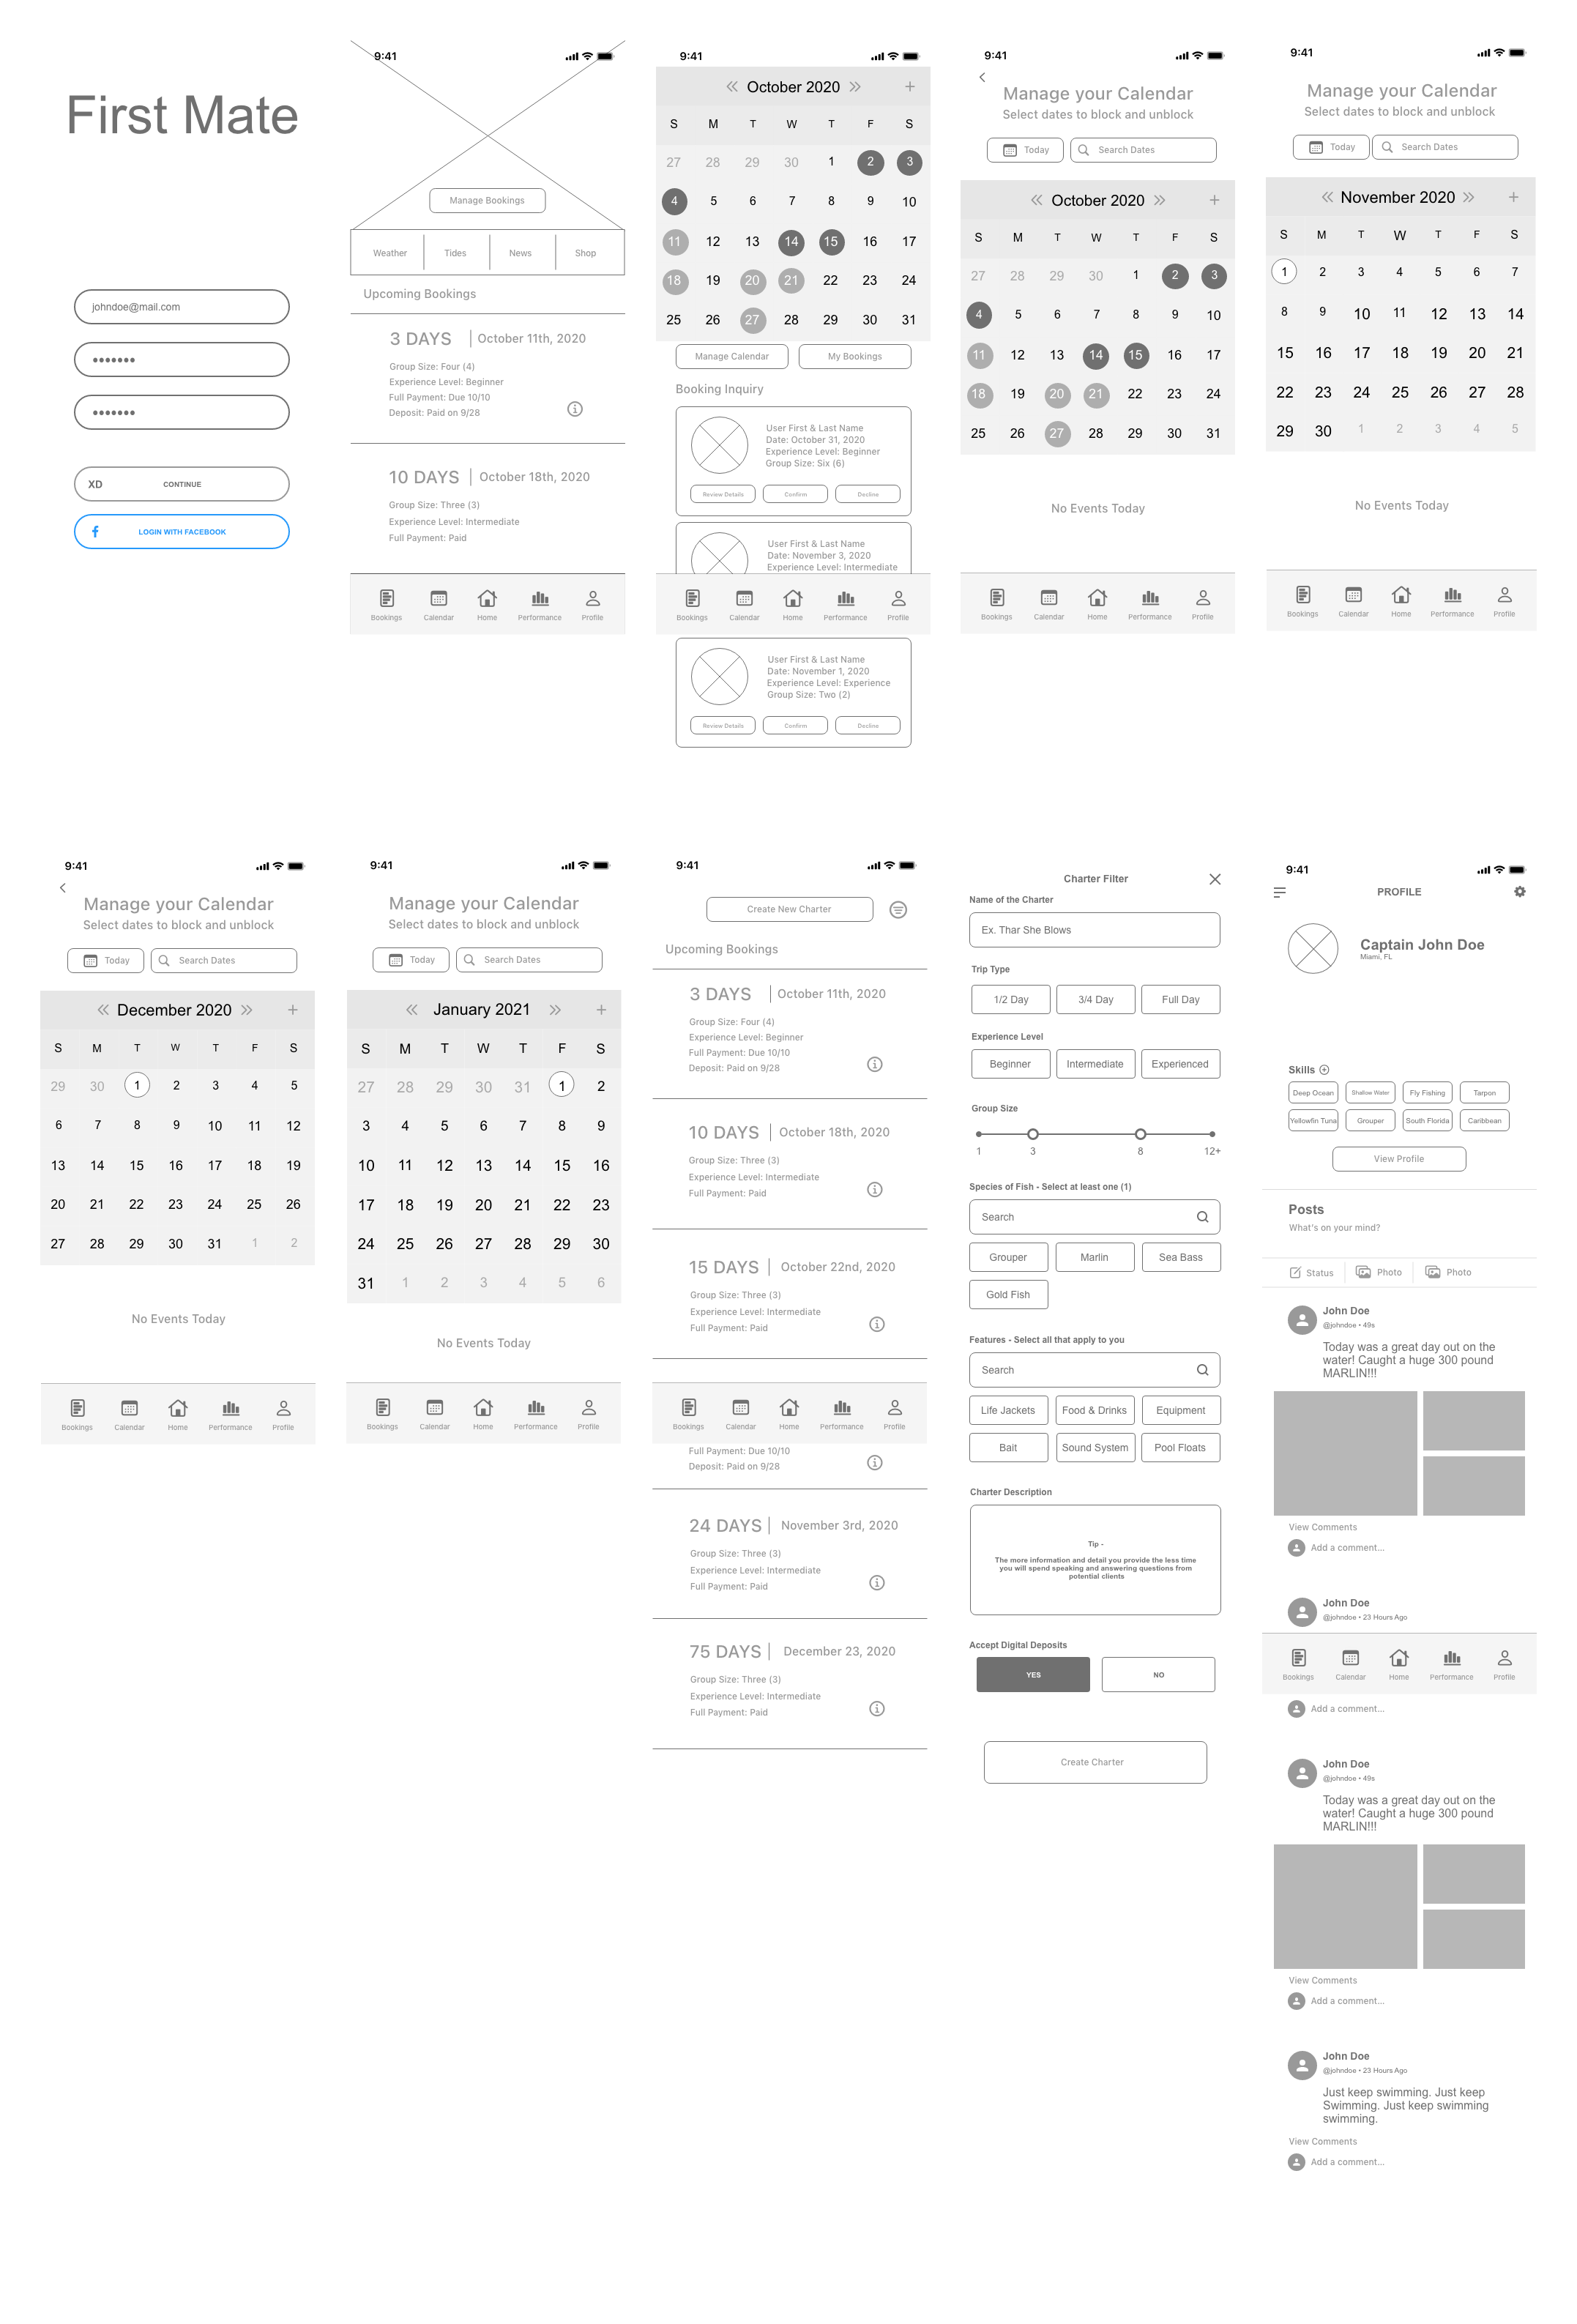
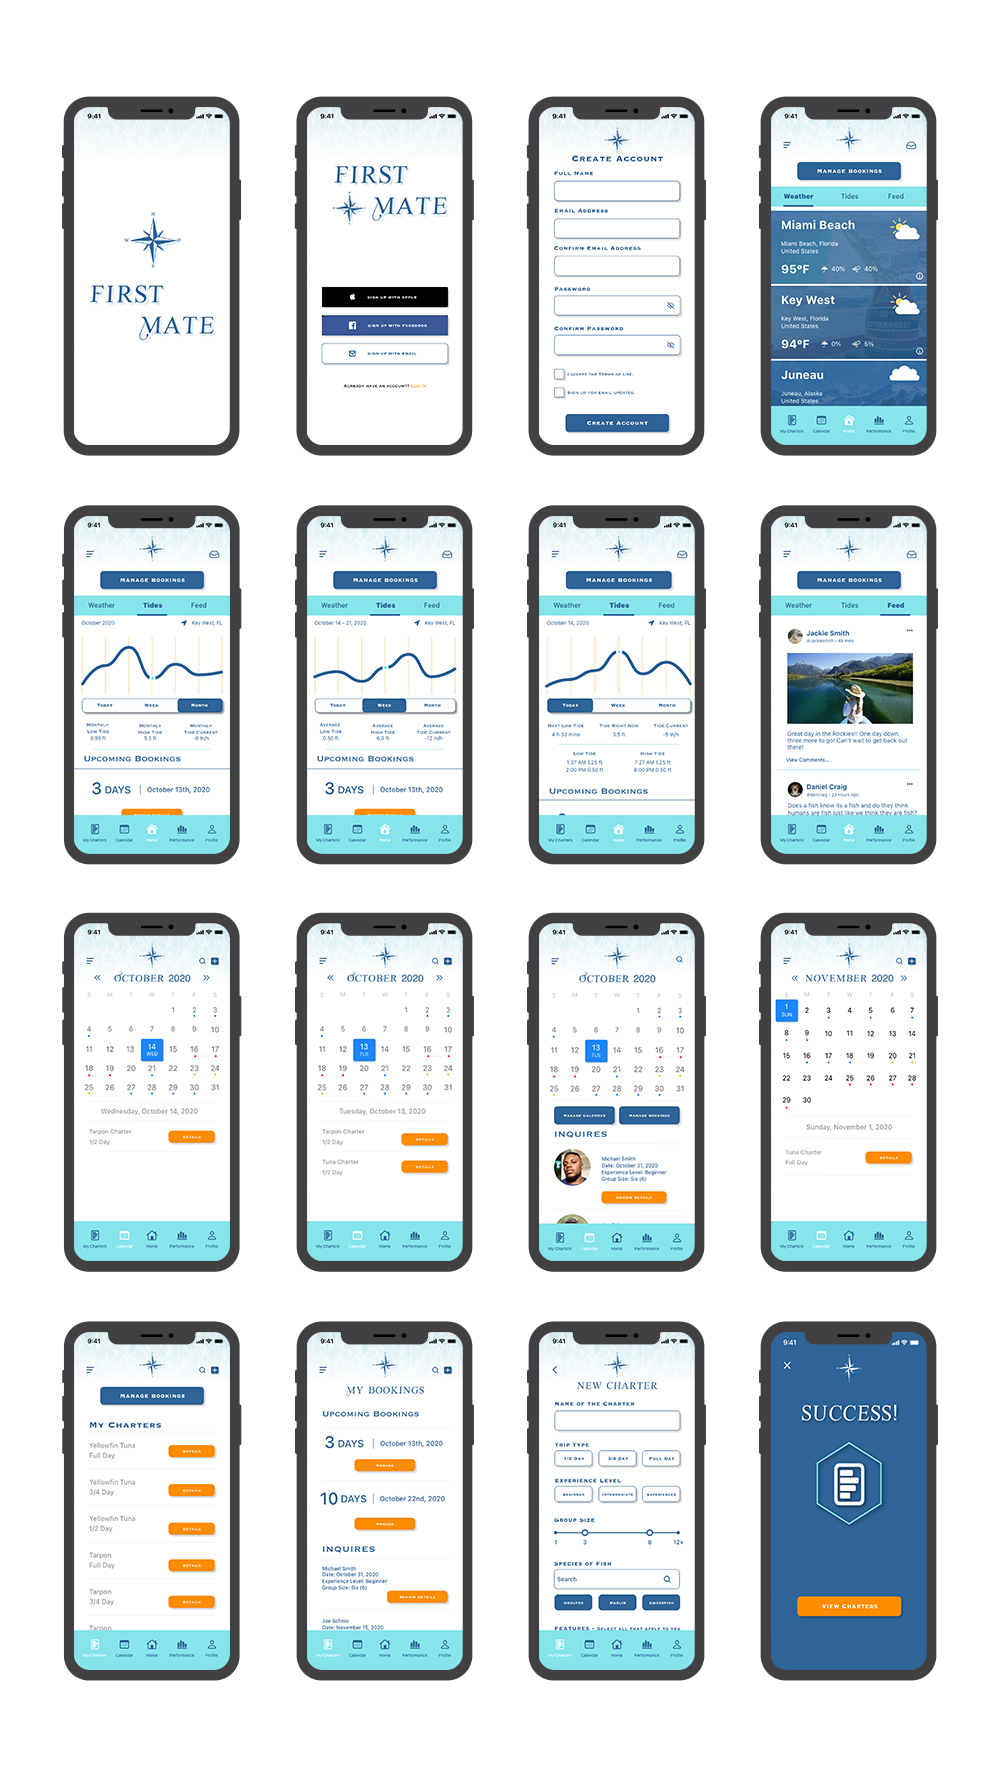
After all of our research and testing, I developed the following Hi-Fi Prototype on a mobile platform. This first iteration of the Hi-Fi Prototype included roughly twenty-four screens. Allowing users to experience the flow of creating an account, setting custom charters, and viewing/managing their calendar.
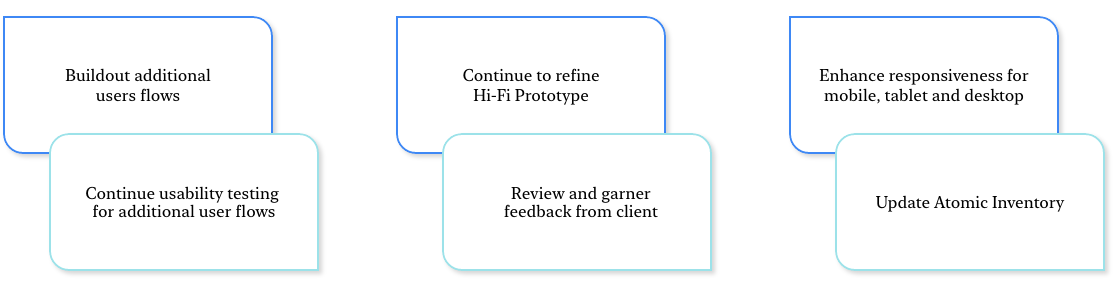
Before closing this chapter, I put together a list of next steps for the stakeholder. This would allow them to review what has been accomplished so far and what more would be needed to get the product to market.
With this project and my time at Ironhack coming to and end, it was a very bitter sweet feeling. On one side, I felt a lot more confident in my processes now having gone through my second two week sprint. On the other, I was quite emotional as I would be leaving the safe haven of Ironhack and going out on my own.

