Invessa
I designed and built a cost segregation platform that lets real estate investors estimate accelerated depreciation themselves and hand a defensible, CPA-ready report to their accountant.
Role
Lead Product Designer
Timeline
Feb 2026 to Present
Problem
A cost segregation study can significantly accelerate depreciation on an investment property, but getting one is slow and expensive. It typically means hiring a specialist firm, which puts it out of reach for most everyday real estate investors. My business partner, a real estate investor himself, brought me the idea after struggling with cost segregation on his own properties, both with the cost and with finding a reputable firm to do the work. The goal: give investors a way to run the analysis themselves, for a fraction of the cost, and understand a property's depreciation before or after they buy it.
My Role
As co-founder, I led the entire product from ideation through design and development, building the web and mobile apps myself with AI-assisted coding.
Research Phase
With no existing users to interview, I started with my business partner, who knew the process firsthand, and studied how cost segregation works: the IRS guidance behind it, the MACRS asset classes, and how traditional studies are built and delivered. I also reviewed the existing cost segregation tools to see where they left investors on their own. Three pain points stood out.
Cost. Traditional studies are priced for large properties, so smaller investors rarely get one.
Opacity. Investors receive a number with little explanation of how it was reached.
Trust. A self-serve estimate is only useful if a CPA will take it seriously.
Design Challenge
“Give everyday real estate investors a cost segregation estimate they can understand, trust, and hand to their CPA, for a fraction of the cost of a formal study.”
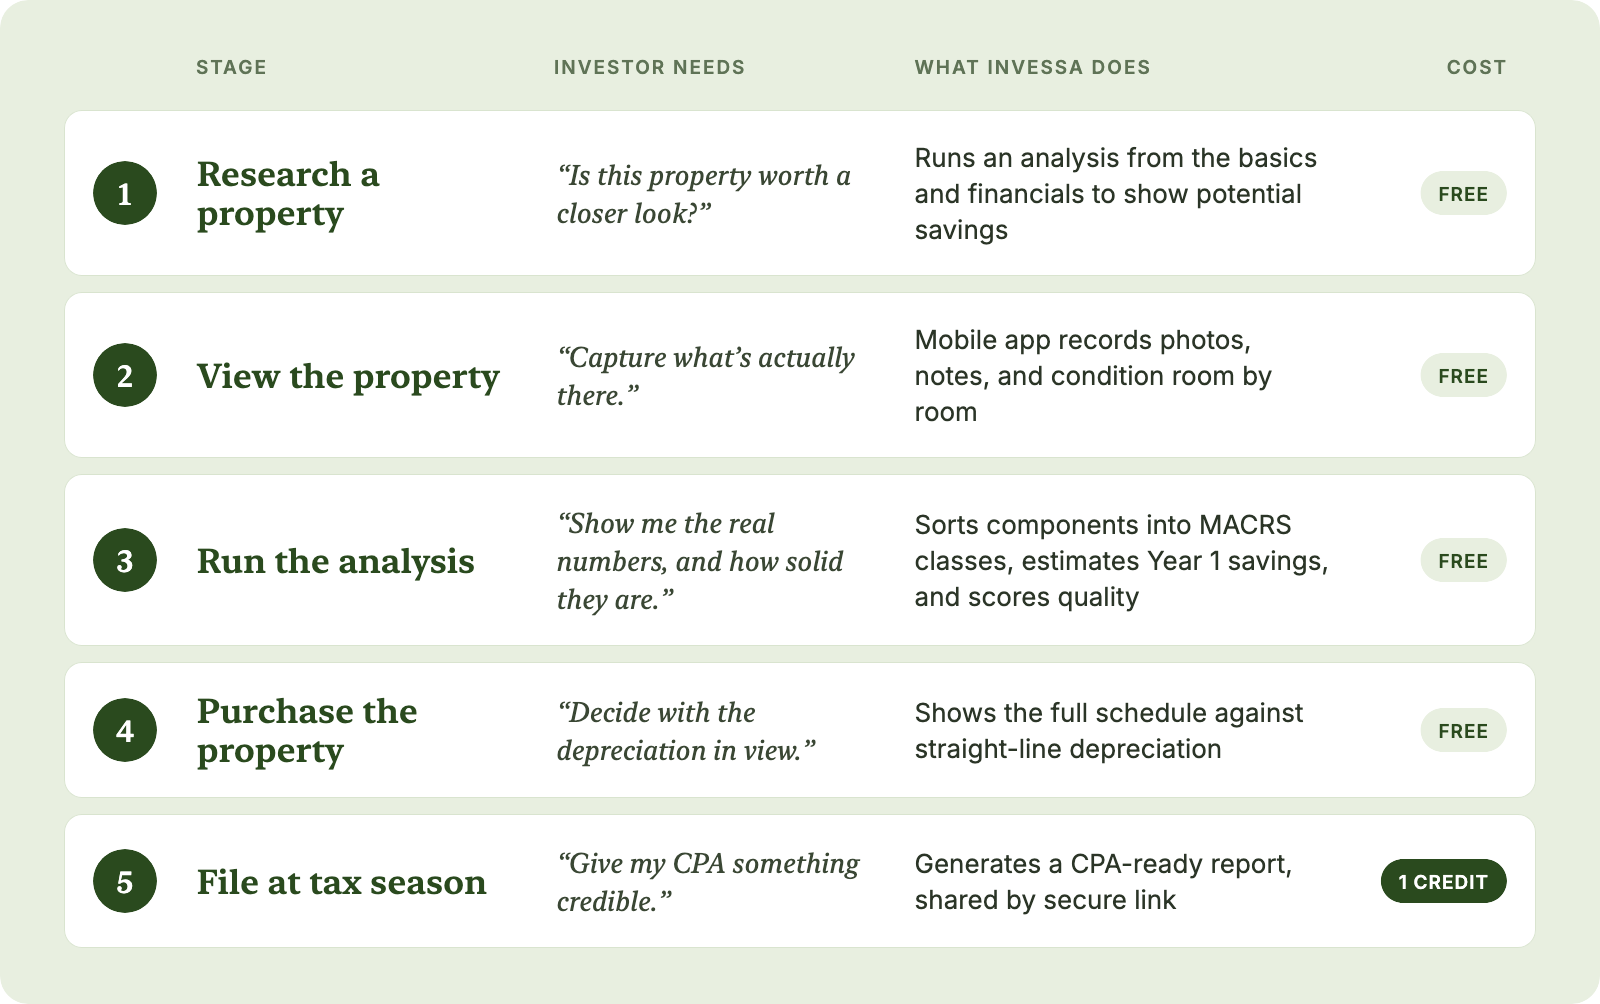
Designing Around the Investor's Journey
Before designing screens, I mapped where cost segregation fits in how an investor actually works: researching a property, viewing it, running the numbers, purchasing it, and filing at tax season. Invessa needed to be useful at every stage, from a quick estimate during research, to capturing details during the walkthrough, to the report handed to a CPA at tax time. That journey shaped the product flow.
A Guided Analysis
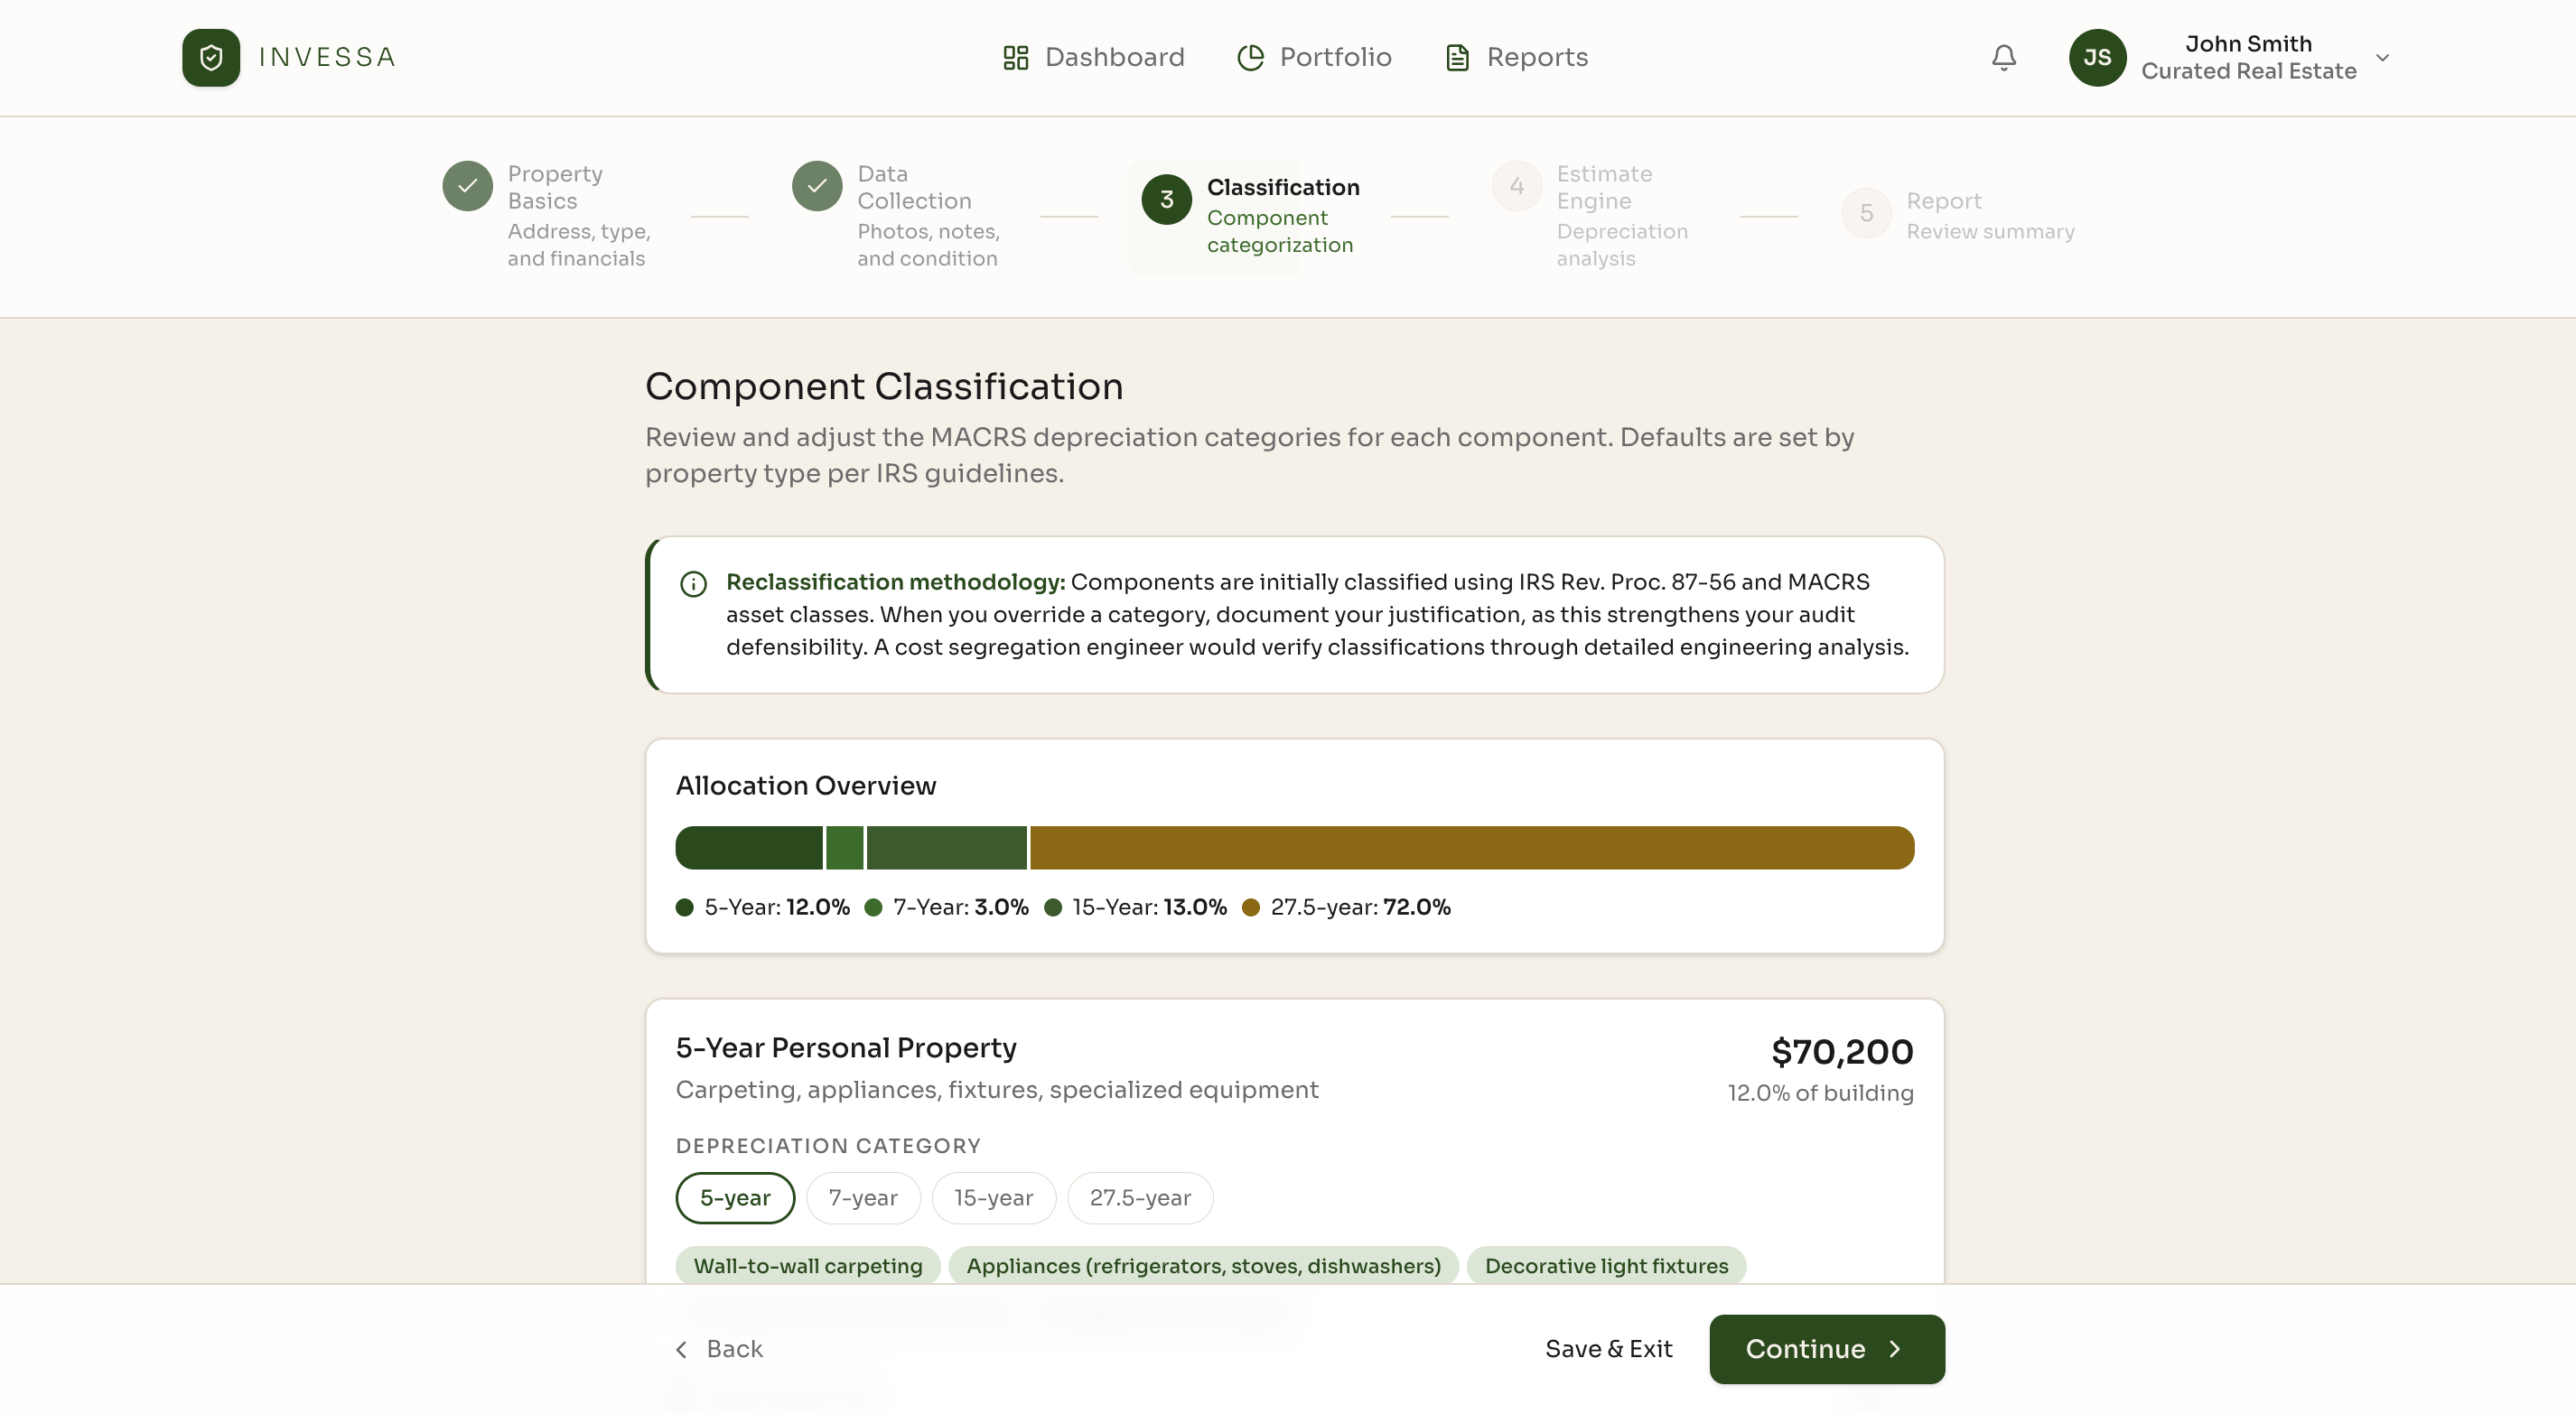
I structured the product around a five-step flow that turns an unfamiliar tax process into a sequence an investor can follow.
Property Basics. Address, property type, and financials.
Data Collection. Photos, notes, and condition, room by room.
Classification. Components sorted into MACRS categories, with defaults set by property type and room to override with a documented reason.
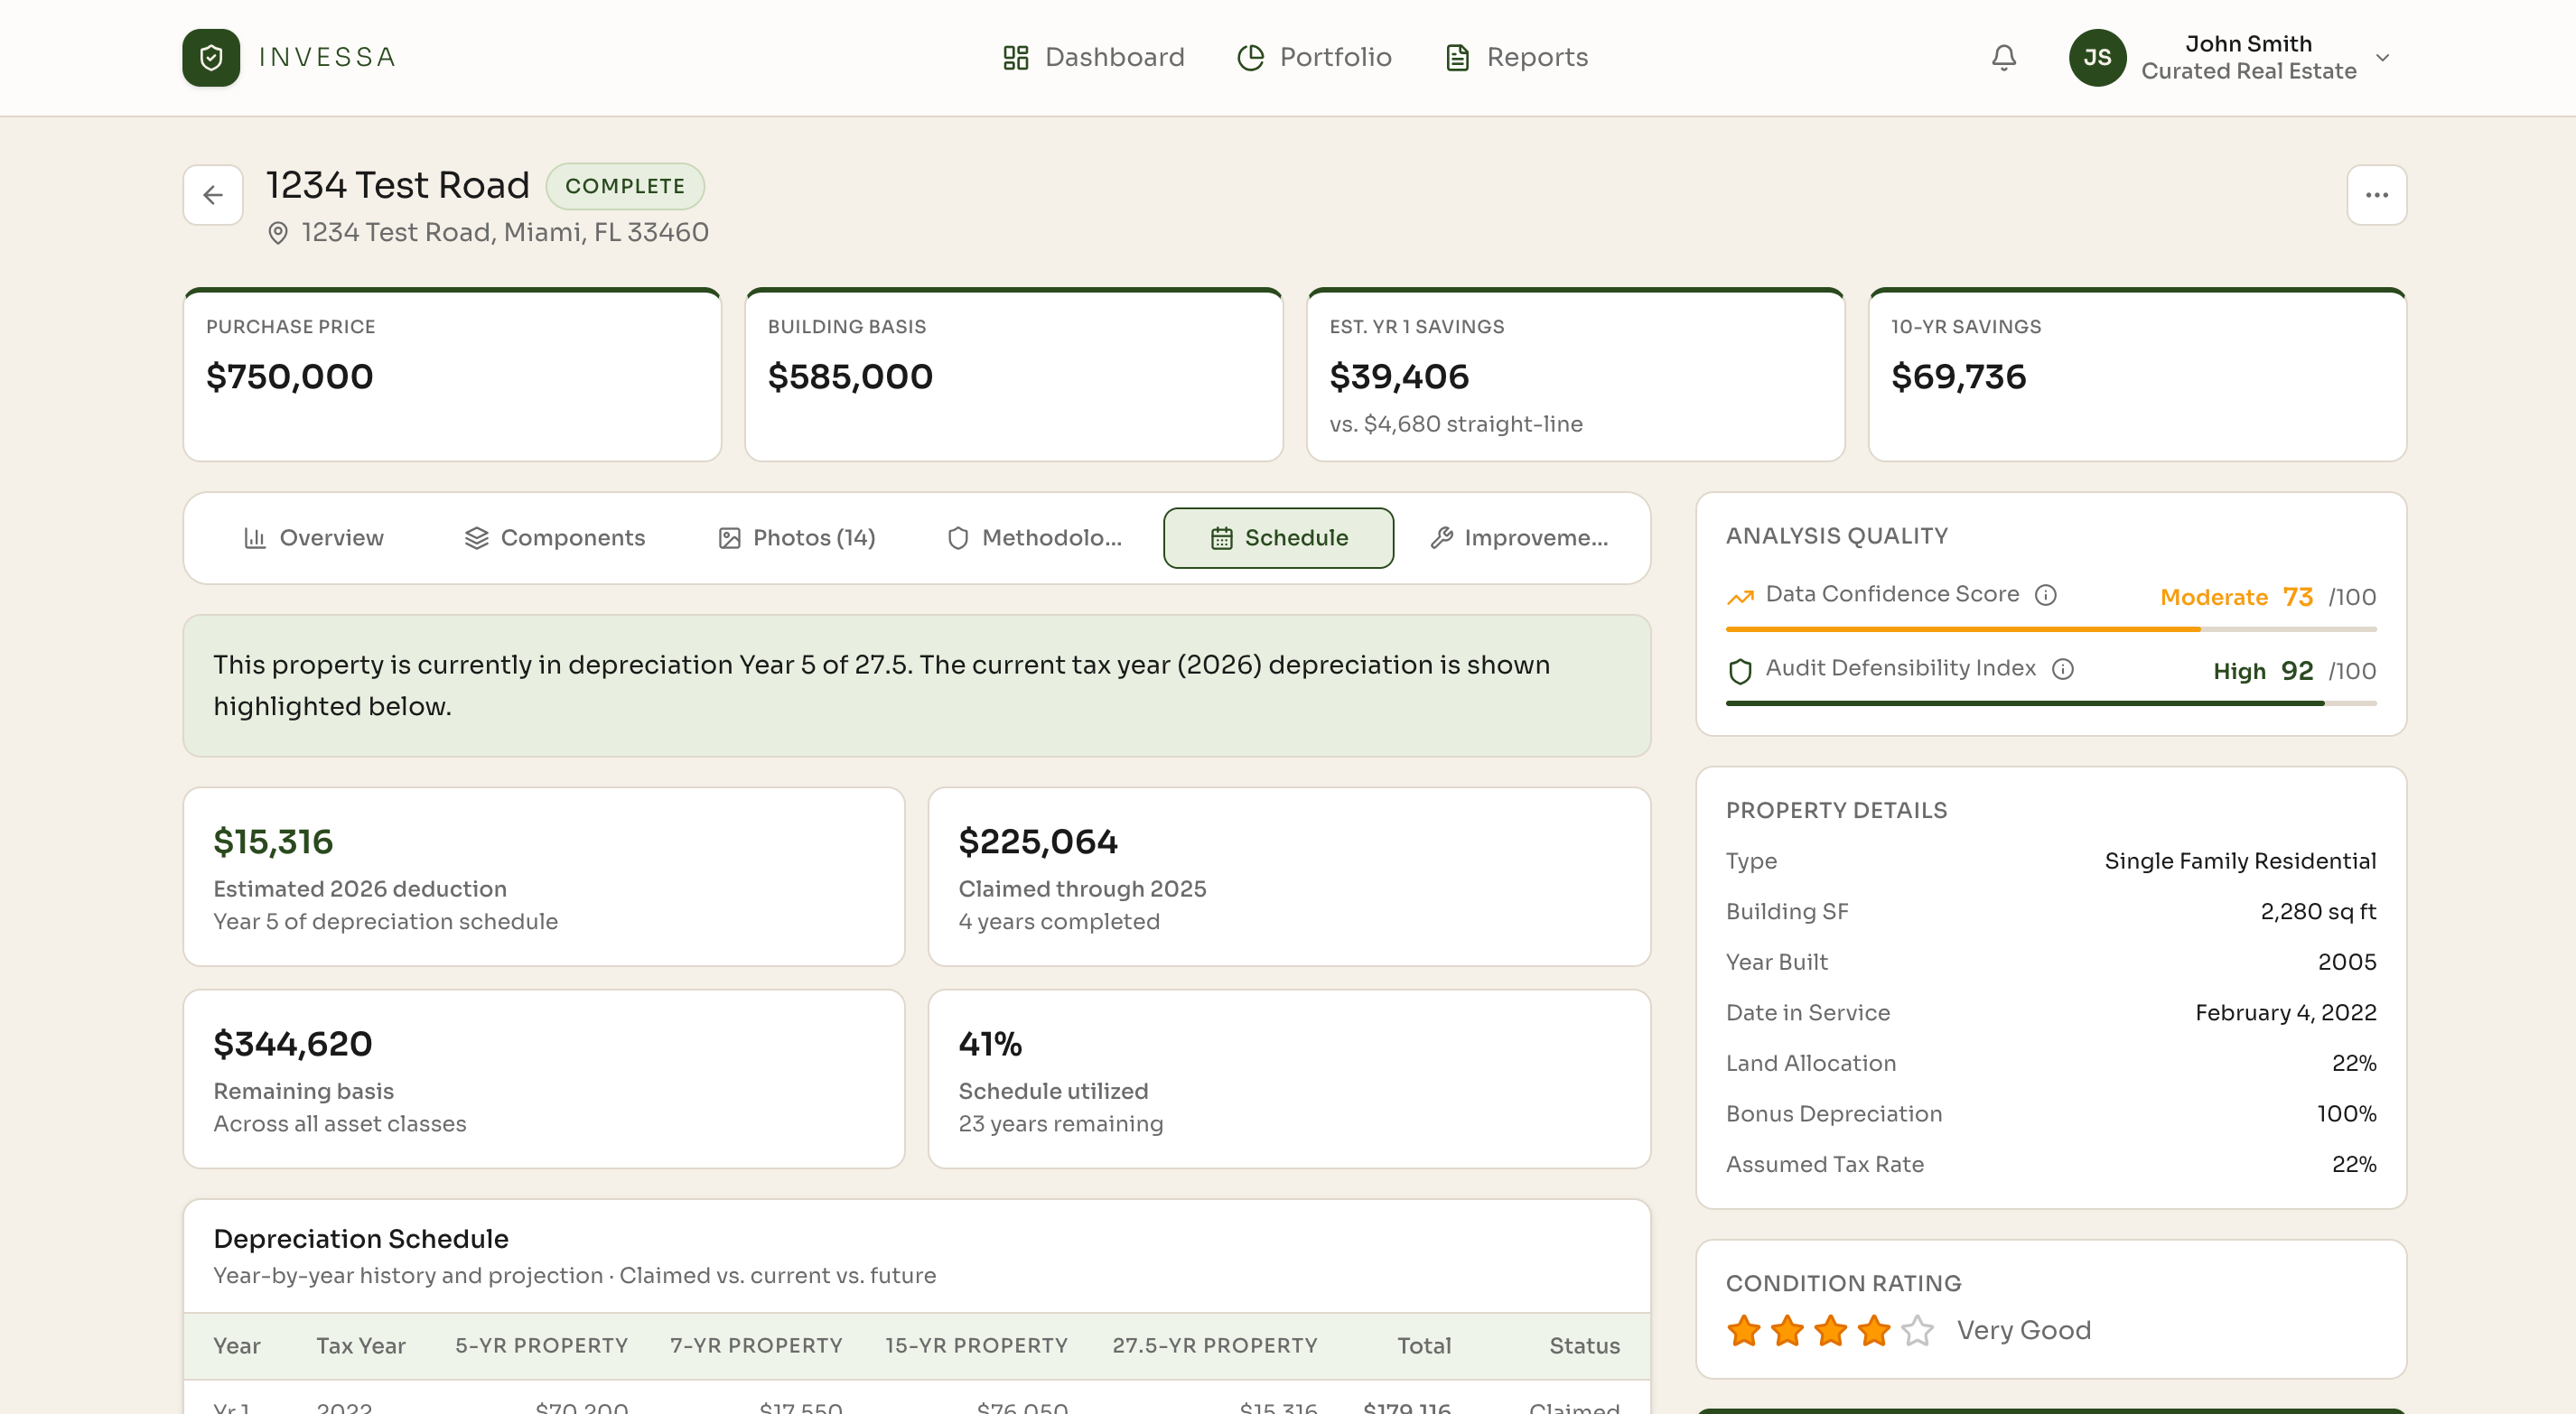
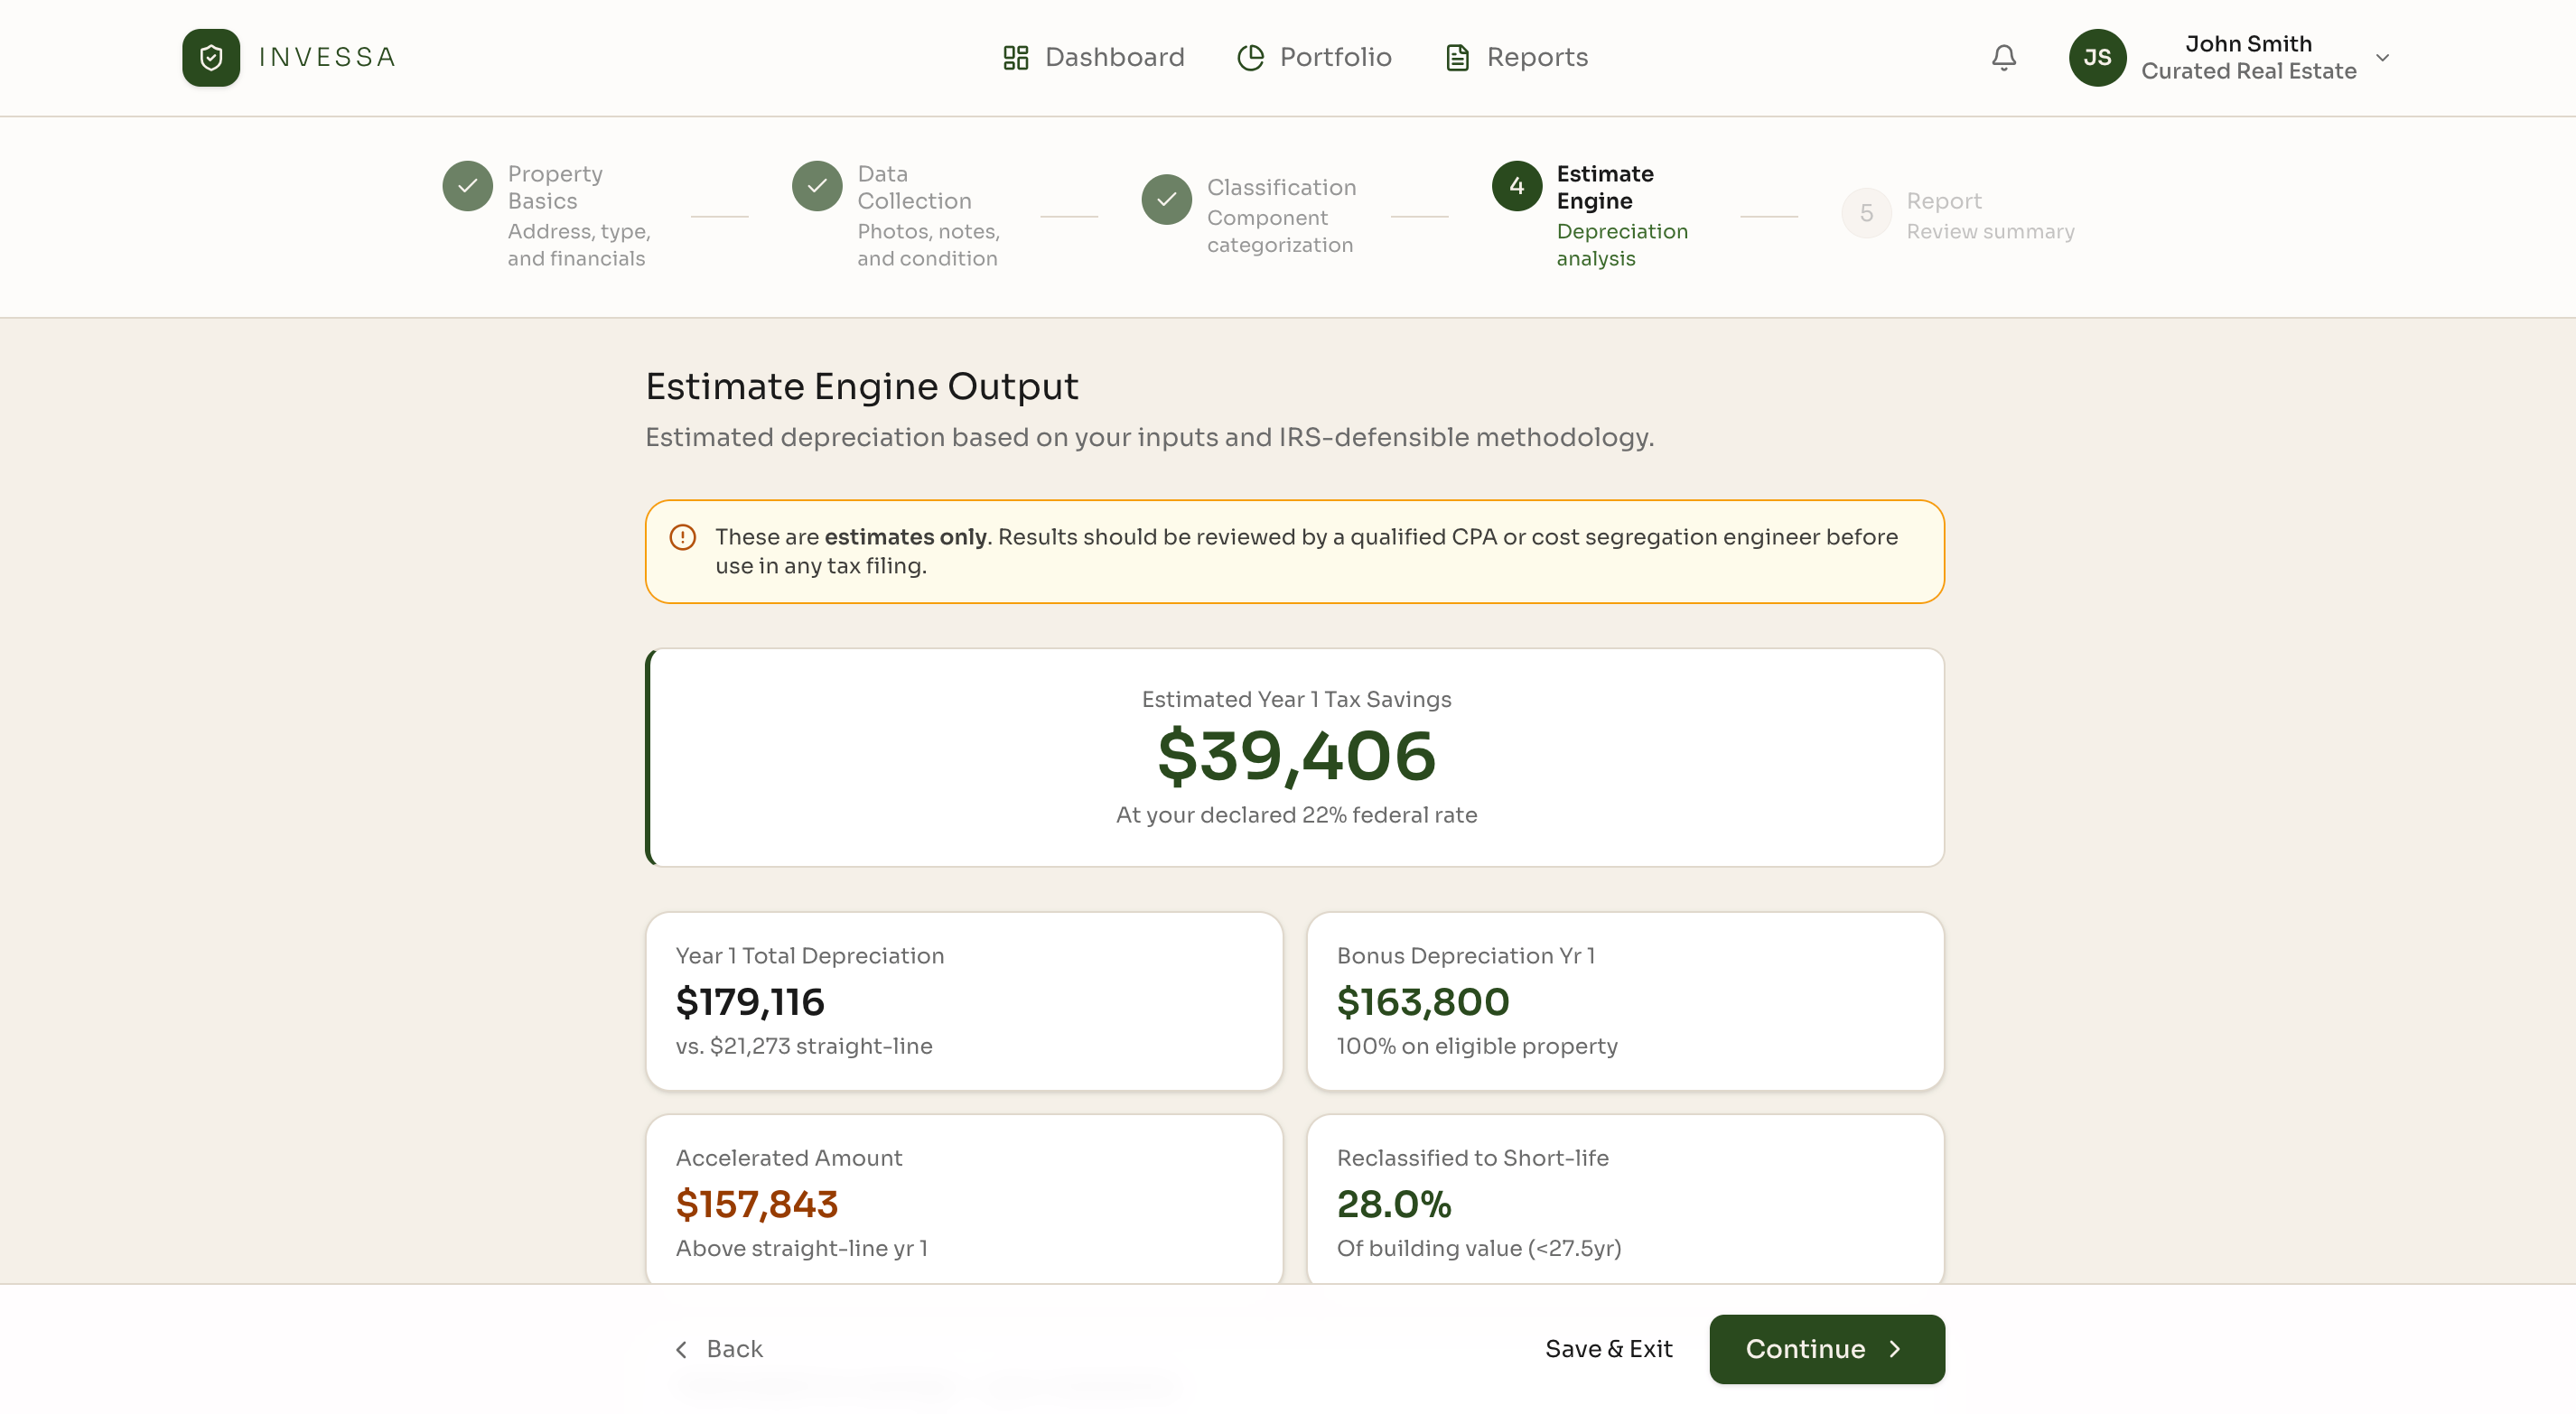
Estimate Engine. Year 1 savings, bonus depreciation, and the full schedule compared to straight-line depreciation.
Report. A CPA-ready document that turns the estimate into something actionable.
Before
After: My Redesign
Key Decision: Two Scores Instead of One
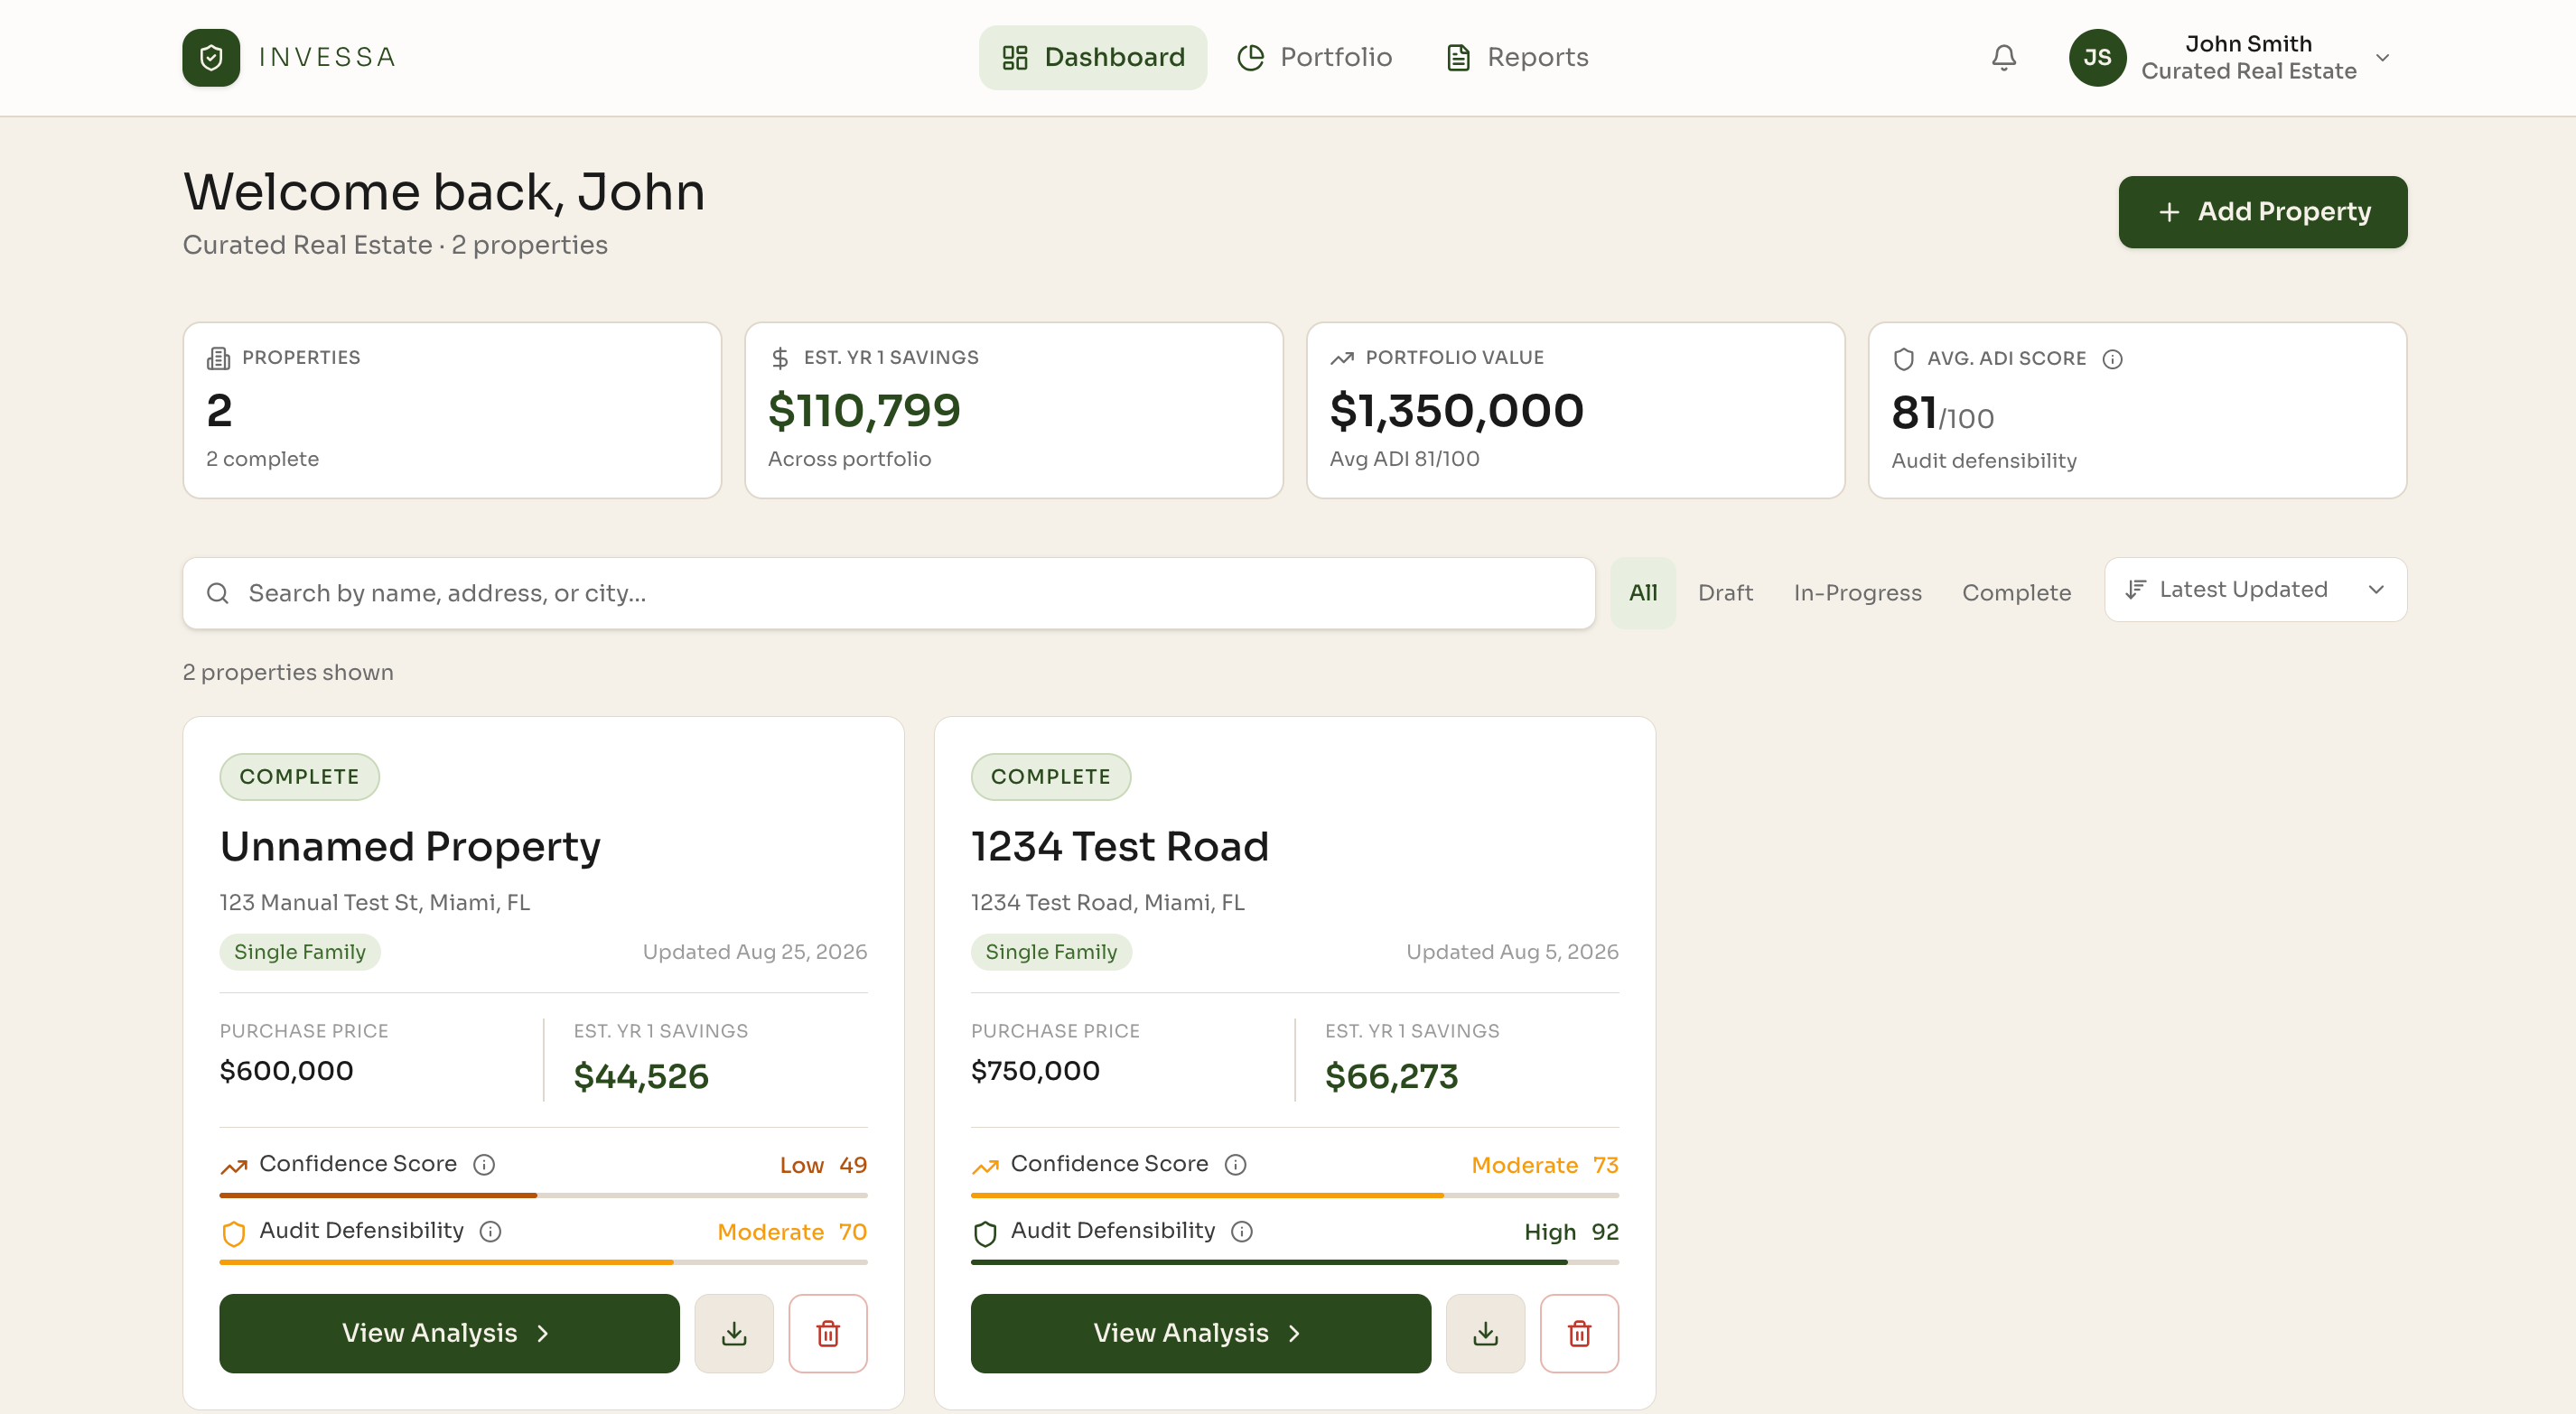
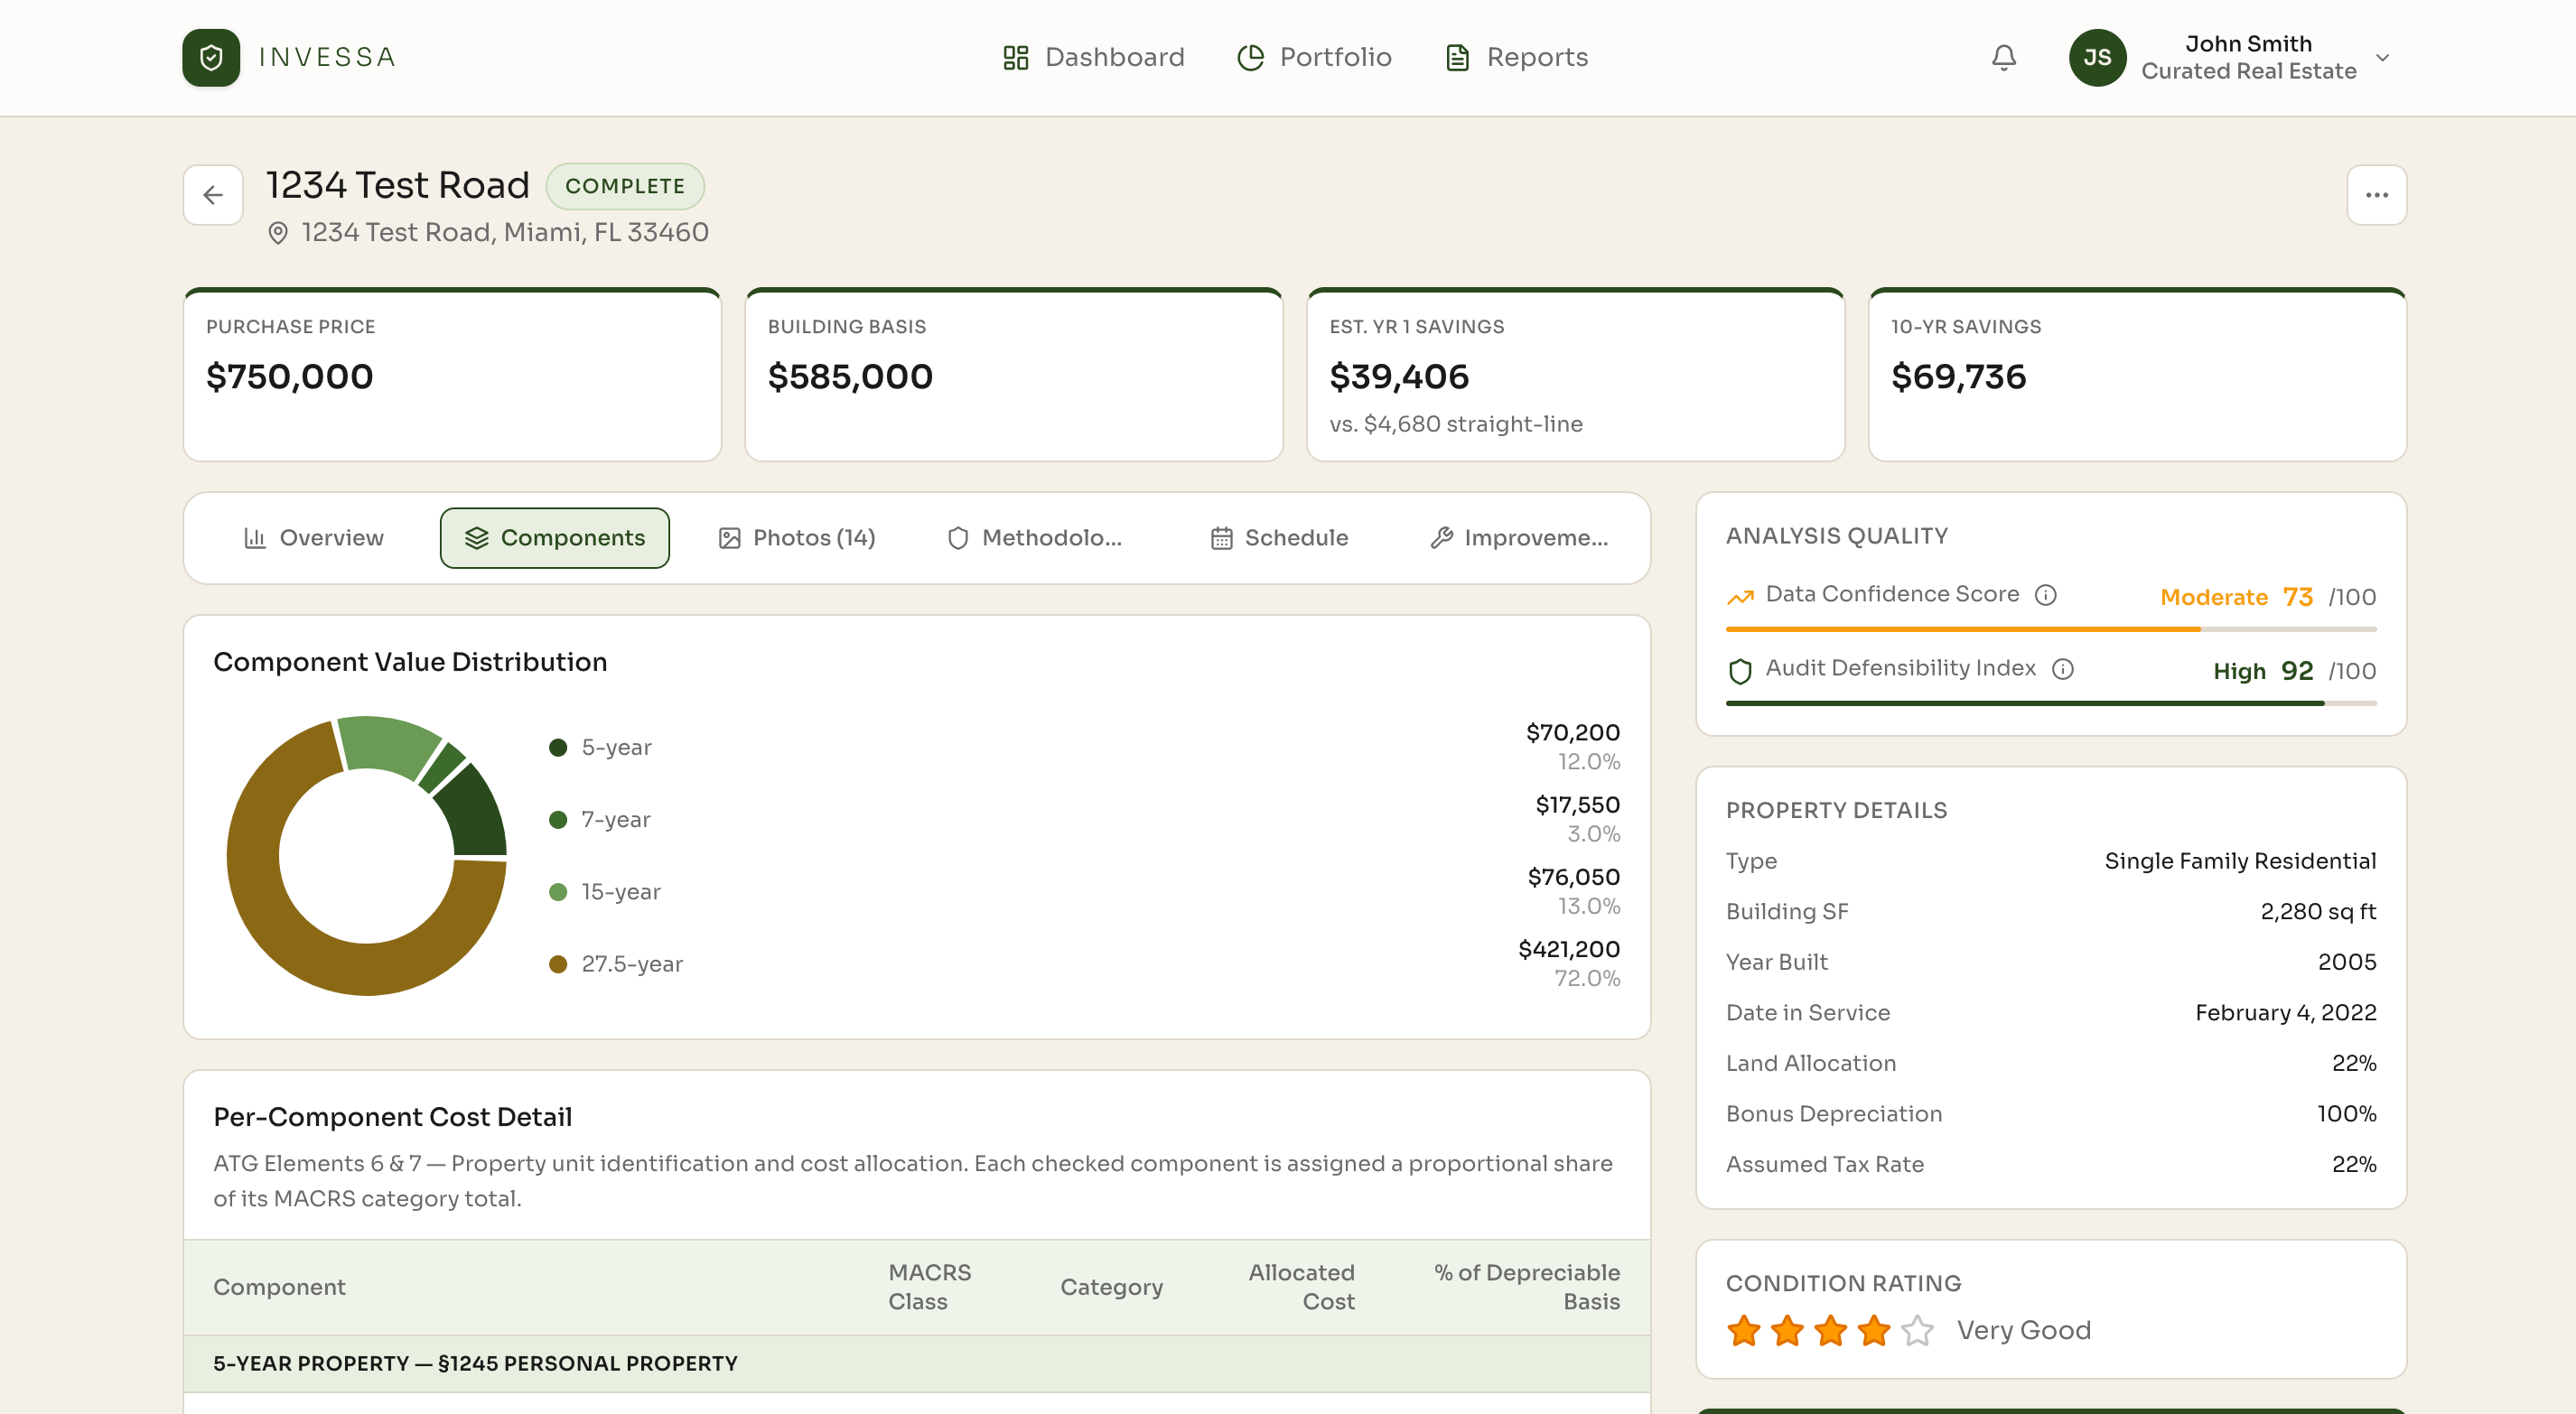
Invessa reports are read by two audiences with different questions. An investor asks whether the analysis rests on good information. A CPA, and eventually the IRS, asks whether it can be defended. Those qualities move independently, so a single blended number could not answer both. In testing, one sample property scored 91 on confidence and 85 on defensibility, while another scored 73 and 92. An average would have hidden what each report actually needed.
Confidence Score. How reliable are the inputs? Driven by photo documentation, component detail, property condition, and land allocation, and mostly in the user's control.
Audit Defensibility Index. How well would the analysis hold up under scrutiny? Measured against the IRS Audit Techniques Guide, covering classification justification, cost reconciliation, and professional review.
Splitting the score made it actionable, since a low number points to a specific fix. When I reviewed the sample reports the way a skeptical CPA would, the scores stood out as the one element with no visible basis, so I added a plain-language explanation to the Methodology section and named the factors while keeping the exact weights private, the way credit scores do.
Key Decision: Free Analysis, Paid Report
Running an analysis is free. Generating the PDF report costs one prepaid credit, sold in packs with volume discounts.
Show the value first. Cost segregation is unfamiliar to most investors. Seeing their own Year 1 savings estimate lets the product prove itself before asking for money.
Pay per report, like a Carfax. Most investors need one report per property, not a monthly tool, so I chose credits over a subscription. It follows a pattern people already know: pay once for a trusted report on a single asset.
Charge for the deliverable, not the calculation. The on-screen result is a preliminary estimate. The report is the professional artifact, with methodology mapped to the IRS Audit Techniques Guide and a CPA sign-off page.
Anchor against formal studies. Traditional engineering-based studies commonly cost thousands of dollars, which makes a single report an easy decision.
Designing the edges of the model. Repeat exports originally charged a new credit, so the generated file is now saved and returned for free. CPAs have no Invessa account, so sharing now emails a secure link that opens the PDF directly, using a random token instead of a guessable property ID. A credit buys a report, and everything that happens to it afterward is free.


Key Decision: Capture the Property While You Walk It
An analysis is only as defensible as the evidence behind it. Photo documentation is the largest single input to the Confidence Score and fills the report's photo appendix, and the phone is already in the investor's hand at the property. I built a React Native app from one codebase for iPhone and Android so users can photograph each room, add notes as they go, and attach everything to the right property in real time.
The app converts iPhone photos into a format the report can render, uploads each image to the cloud as it is taken, and shares finished reports through the phone's native share sheet. Desktop is for the sit-down work: detailed financial inputs and reviewing the full report.
Building and Testing
The hardest problem was upload reliability. A photo saved quickly could lose its cloud location because the background upload and the save raced each other, and the first fix that looked correct failed repeated testing on a real iPhone. It took several rounds to solve, and reinforced a lesson that recurred across the project: code that compiles cleanly is not the same as code that works on a real device.
Scoping the First Release
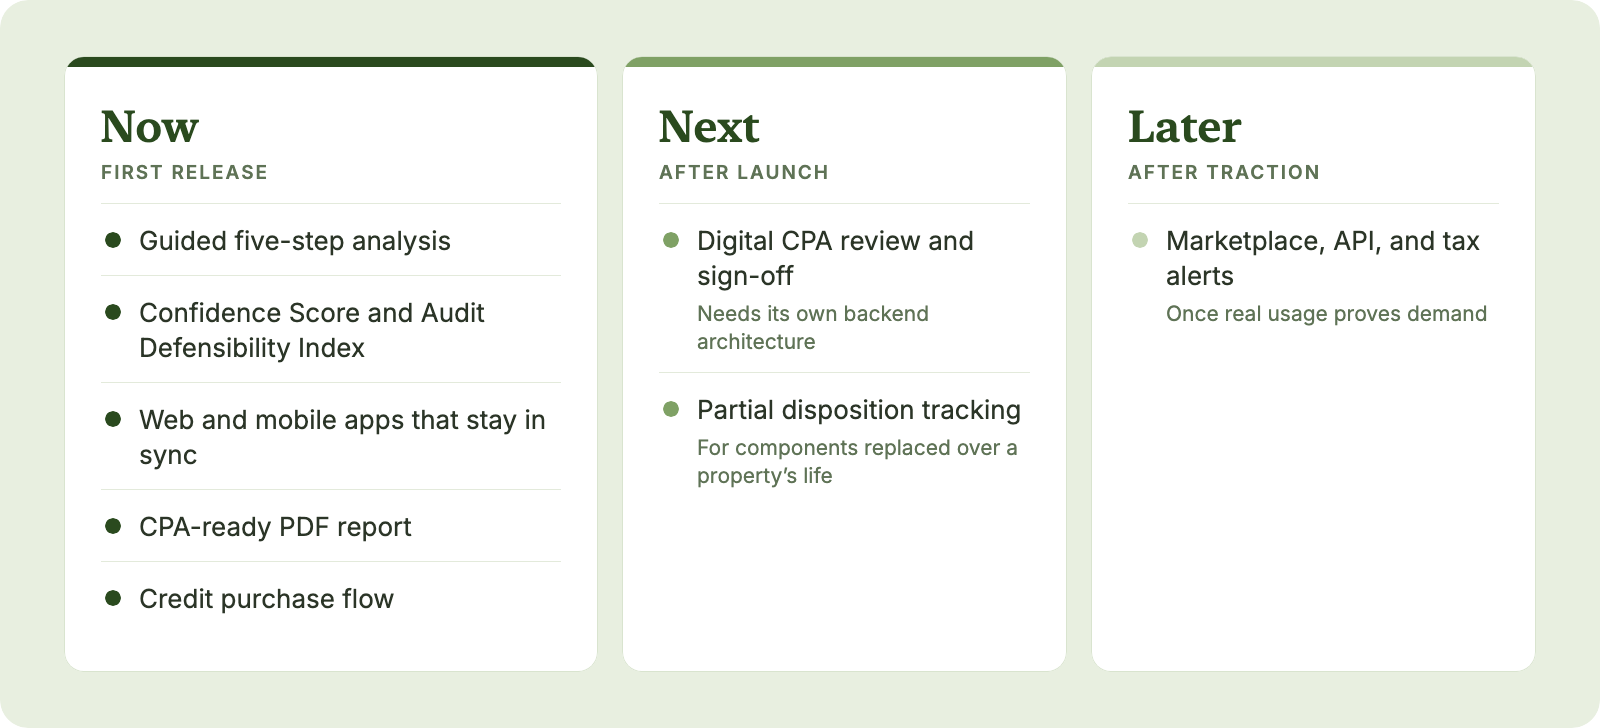
As the only builder, I could see the cost of every feature, so I scoped the first release to what an investor needs to get from a property to a report.
Where It Stands
The web and mobile apps, scoring, report generation, and the credit purchase flow are built, and Invessa is preparing to launch in 2027. Before launch, my business partner is gathering feedback from other investors, and the next step is having CPAs review sample reports against IRS standards.
5
Guided steps from property details to report
12
Sections in the CPA-ready report
13
IRS Audit Techniques Guide elements mapped
What's Next
After launch, the questions shift from whether it works to whether it gets used: how many free analyses turn into a paid report, how long it takes to finish an analysis, and where investors drop off. The roadmap includes a digital CPA review and sign-off workflow, so an accountant can approve a report inside the product, and tracking for partial dispositions when components are replaced over a property's life.
What I Learned
Building the product myself changed how I design. Code that compiles is not the same as code that works on a real device, and a screen that looks right in a mockup isn't proof it works either. Designing for two audiences, investors and CPAs, taught me to make trust visible through clear scores and methodology instead of assuming it. Starting from zero with one domain expert also taught me to treat launch as the next round of research, with clear questions for real investors and CPAs to answer.